OPEN-SOURCE SCRIPT
已更新 Rotation Cycles Graph
Rotation Cycles Graph Indicator
Overview:
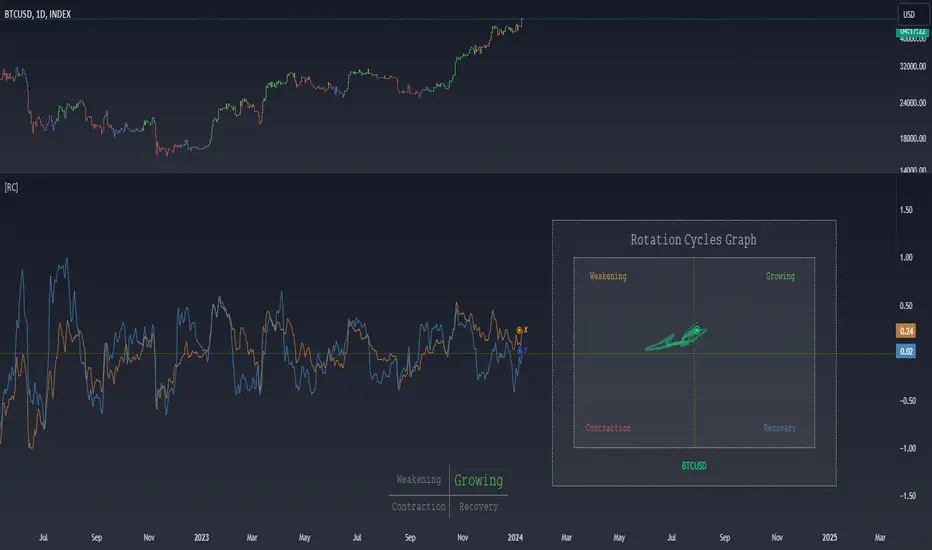
The Rotation Cycles Graph Indicator is designed to visualize rotation cycles in financial markets. It aims to provide insights into shifts between various market phases, including growth, weakening, recovery, and contraction, allowing traders to potentially identify changing market dynamics.
Key Components:
Customizable Parameters:
The indicator offers users the flexibility to adjust several parameters:
Understanding Coordinates:
The x and y coordinates plotted on the chart represent specific market conditions. Interpretation of these coordinates aids in recognizing shifts in market behavior.
This screenshot shows visual representation behind logic of X and Y and their rotation cycles

Here is an example how rotation marker moved from growing to weakening and to the contraction quad, during a big market crush:

Note:
This indicator is a visualization tool and should be used in conjunction with other analytical methods for comprehensive market analysis.
Understanding the context and nuances of market dynamics is essential for accurate interpretation of the Rotation Cycles Graph Indicator.
Big thanks to PineCodersTASC for their indicator, what I used as a reference
https://in.tradingview.com/script/AsEv0Vxd-TASC-2022-07-Pairs-Rotation-With-Ehlers-Loops/
Overview:
The Rotation Cycles Graph Indicator is designed to visualize rotation cycles in financial markets. It aims to provide insights into shifts between various market phases, including growth, weakening, recovery, and contraction, allowing traders to potentially identify changing market dynamics.
Key Components:
- Z-Score Calculation:
The indicator employs Z-score calculation to normalize data and identify deviations from the mean. This is instrumental in understanding the current state of the market relative to its historical behavior. - Ehlers Loop Visualization:
The Ehlers Loop function generates a visual representation of rotation cycles. It utilizes x and y coordinates on the chart to represent market conditions. These coordinates determine the position and categorization of the market state. - Table Visualization:
At the bottom of the chart, a table categorizes market conditions based on x and y values. This table serves as a reference to understand the current market phase.
Customizable Parameters:
The indicator offers users the flexibility to adjust several parameters:
- Length and Smoothness: Users can set the length and smoothness parameters for the Z-score calculation, allowing for customization based on the market's volatility.
- Graph Settings: Parameters such as bar scale, graph position, and the length of the tail for visualization can be fine-tuned to suit individual preferences.
Understanding Coordinates:
The x and y coordinates plotted on the chart represent specific market conditions. Interpretation of these coordinates aids in recognizing shifts in market behavior.
This screenshot shows visual representation behind logic of X and Y and their rotation cycles
Here is an example how rotation marker moved from growing to weakening and to the contraction quad, during a big market crush:
Note:
This indicator is a visualization tool and should be used in conjunction with other analytical methods for comprehensive market analysis.
Understanding the context and nuances of market dynamics is essential for accurate interpretation of the Rotation Cycles Graph Indicator.
Big thanks to PineCodersTASC for their indicator, what I used as a reference
https://in.tradingview.com/script/AsEv0Vxd-TASC-2022-07-Pairs-Rotation-With-Ehlers-Loops/
版本注释
Rescale function版本注释
Moved name of the ticker to the bottom of the graph版本注释
-版本注释
Alerts Update开源脚本
秉承TradingView的精神,该脚本的作者将其开源,以便交易者可以查看和验证其功能。向作者致敬!您可以免费使用该脚本,但请记住,重新发布代码须遵守我们的网站规则。
免责声明
这些信息和出版物并非旨在提供,也不构成TradingView提供或认可的任何形式的财务、投资、交易或其他类型的建议或推荐。请阅读使用条款了解更多信息。
开源脚本
秉承TradingView的精神,该脚本的作者将其开源,以便交易者可以查看和验证其功能。向作者致敬!您可以免费使用该脚本,但请记住,重新发布代码须遵守我们的网站规则。
免责声明
这些信息和出版物并非旨在提供,也不构成TradingView提供或认可的任何形式的财务、投资、交易或其他类型的建议或推荐。请阅读使用条款了解更多信息。