PROTECTED SOURCE SCRIPT
Weather Vane

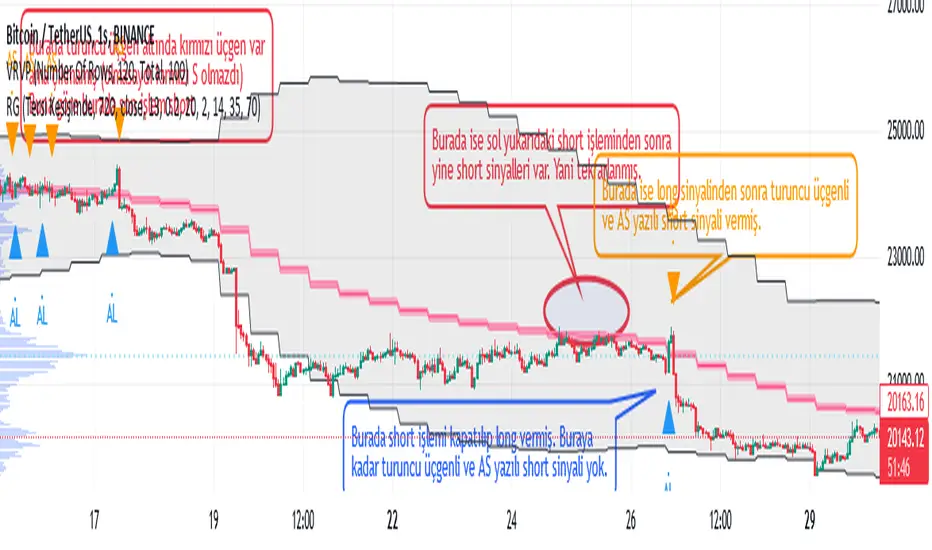
Why is the indicator called 'wind Vane'? Because in this indicator, the trade is entered according to which side the price cuts the EMA that you will determine.
For example, if we have chosen EMA_X as 13, if the price cuts ema13 up within the tolerance you specify, it enters the LONG transaction, if it cuts down, it enters the SHORT transaction and closes the opposite direction while entering a transaction. In other words, the 'wind rose' as the price moves towards that direction (it is blown according to the wind) :)
Explanation on "Açık Pozisyonun Çıkış Koşullarını Seçin": If "Tersi Kesişimde" option is selected, the closing of the open trade is only possible when the price cuts the EMA_X+-tolerance value in the opposite direction. For example, if the price has cut the EMA_X+tolerance up and LONG has been entered in the transaction, this LONG transaction will be closed only by cutting the EMA_X-tolerance back down and entering the SHORT transaction.
If the "BB Sınırında" option is selected, the closing of the open trade is when the price reaches the Bollinger Band limit. For example, if the last price cut the EMA_X+tolerance up and a LONG trade was opened, this trade will be closed if the price comes from below and reaches the upper limit of the Bollinger Band. SHORT The transaction is closed when the price comes from above and reaches the lower limit of the Bollinger Band (black diamond appears as a figure).
If the "OB ve OS'larda" option is selected, the condition of reaching the above Bollinger Band limit for trades to be closed, plus the fact that the RSI exceeds the OverSold (base limit) and OverBought (ceiling limit) values specified in the settings tab of the indicator. (Visible as a navy blue diamond shape)
EMA, Bollinger Band and RSI values in the conditions of entering a LONG or SHORT trade or closing the trade, whatever it is, are calculated according to the candle duration to be selected from here, independently of the candle duration selected on the chart, and printed on the chart, and the trades are realized at the values of this selected candle period.
The default state is based on 720-minute, 12h (12-hour) candles. In this default state, even if you select the candle duration of 1 hour from the chart, whether the trading conditions are met or not is checked according to the RSI EMA_X and BBand values in 720 minutes.
When "any alert condition" is selected while setting an alarm, a single alarm will be set on all alarm conditions and it will notify (by specifying which condition) which alarm condition is met. However, when setting the alarm, it reports once in each candle according to the candle duration selected on the chart. For example, let's say that we have chosen the candle duration of 5 minutes on the chart, and we have chosen the TFM as 720 minutes, that is, 12h. In this case, even if any condition is met multiple times within 5 minutes, it only tells us the first one. If the condition is still met at the opening of the new candle, it will report once in the new candle, and now, even if the condition is met again a hundred times in the last candle, it will only report the first one. If the opposite condition is met within 5 minutes and the last trade entered by moving long steps, the price will be closed and the entry to the opposite direction may be delayed, you can select the candle duration of 1 minute from the chart.
In the meantime, it can give LONG notifications over and over while already in LONG position, but since the balance is fully processed in the first, subsequent LONG notifications do not matter. Likewise SHORT and pose exit notifications.
版本注释
ENG : Repetitive signals (same) were filtered out.
TR:
Tekrarlayan sinyaller (aynı) filtrelendi.
版本注释
Alert conditions have been arranged版本注释
Eng: Alarm conditions updated based on corrected Long and Short conditionsTr: Alarm kondüsyonları, düzeltilen Long ve Short kondüsyonlarına göre güncellendi
版本注释
Alarm message text fixed受保护脚本
此脚本以闭源形式发布。 但是,您可以自由使用,没有任何限制 — 了解更多信息这里。
免责声明
这些信息和出版物并非旨在提供,也不构成TradingView提供或认可的任何形式的财务、投资、交易或其他类型的建议或推荐。请阅读使用条款了解更多信息。
受保护脚本
此脚本以闭源形式发布。 但是,您可以自由使用,没有任何限制 — 了解更多信息这里。
免责声明
这些信息和出版物并非旨在提供,也不构成TradingView提供或认可的任何形式的财务、投资、交易或其他类型的建议或推荐。请阅读使用条款了解更多信息。