PROTECTED SOURCE SCRIPT
TrendFlow
The TrendFlow_VolHub is a clean, trend-following indicator built on a simple yet effective core of Exponential Moving Averages (EMAs). It provides clear visual cues for trend direction, volatility, and key support/resistance levels.
Key Features
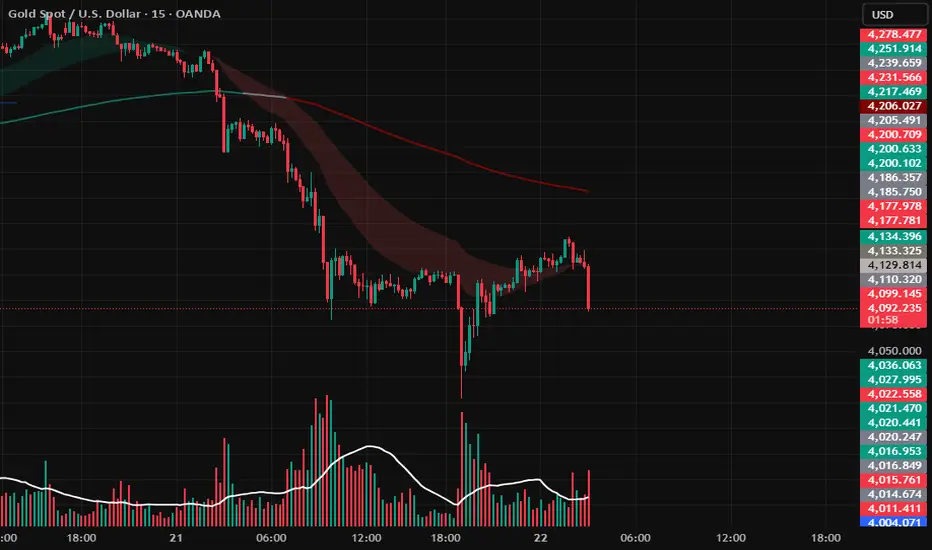
Dynamic EMA Ribbon (21/50):
The area between the EMA 21 and EMA 50 is filled with color to clearly visualize the short-term trend momentum.
Green Fill: EMA 21 is above EMA 50 (Bullish Momentum).
Red Fill: EMA 21 is below EMA 50 (Bearish Momentum).
A user-adjustable Fill Opacity input (0-100) is included for customization.
Dynamic EMA 200 (Long-Term Filter):
The EMA 200 serves as a powerful long-term trend filter and major support/resistance.
Its color dynamically changes based on its position relative to the EMA 21 and EMA 50:
Teal/Green: EMA 200 is below both the 21 and 50 (Strong Bullish Alignment).
Red/Maroon: EMA 200 is above both the 21 and 50 (Strong Bearish Alignment).
Gray: The EMAs are crossing or choppy (Neutral/Consolidation).
Suggested Use
Trend Confirmation: Use the Ribbon color (Green/Red) to confirm the immediate directional bias.
Trend Strength: Use the EMA 200 color as a high-level filter. A bullish ribbon (green) combined with a teal/green 200 EMA suggests a high-conviction uptrend.
Dynamic S/R: The EMA lines themselves can be used as dynamic support and resistance levels.
Key Features
Dynamic EMA Ribbon (21/50):
The area between the EMA 21 and EMA 50 is filled with color to clearly visualize the short-term trend momentum.
Green Fill: EMA 21 is above EMA 50 (Bullish Momentum).
Red Fill: EMA 21 is below EMA 50 (Bearish Momentum).
A user-adjustable Fill Opacity input (0-100) is included for customization.
Dynamic EMA 200 (Long-Term Filter):
The EMA 200 serves as a powerful long-term trend filter and major support/resistance.
Its color dynamically changes based on its position relative to the EMA 21 and EMA 50:
Teal/Green: EMA 200 is below both the 21 and 50 (Strong Bullish Alignment).
Red/Maroon: EMA 200 is above both the 21 and 50 (Strong Bearish Alignment).
Gray: The EMAs are crossing or choppy (Neutral/Consolidation).
Suggested Use
Trend Confirmation: Use the Ribbon color (Green/Red) to confirm the immediate directional bias.
Trend Strength: Use the EMA 200 color as a high-level filter. A bullish ribbon (green) combined with a teal/green 200 EMA suggests a high-conviction uptrend.
Dynamic S/R: The EMA lines themselves can be used as dynamic support and resistance levels.
受保护脚本
此脚本以闭源形式发布。 但是,您可以自由使用它,没有任何限制 — 在此处了解更多信息。
免责声明
这些信息和出版物并不意味着也不构成TradingView提供或认可的金融、投资、交易或其它类型的建议或背书。请在使用条款阅读更多信息。
免责声明
这些信息和出版物并不意味着也不构成TradingView提供或认可的金融、投资、交易或其它类型的建议或背书。请在使用条款阅读更多信息。