PROTECTED SOURCE SCRIPT
atrATR
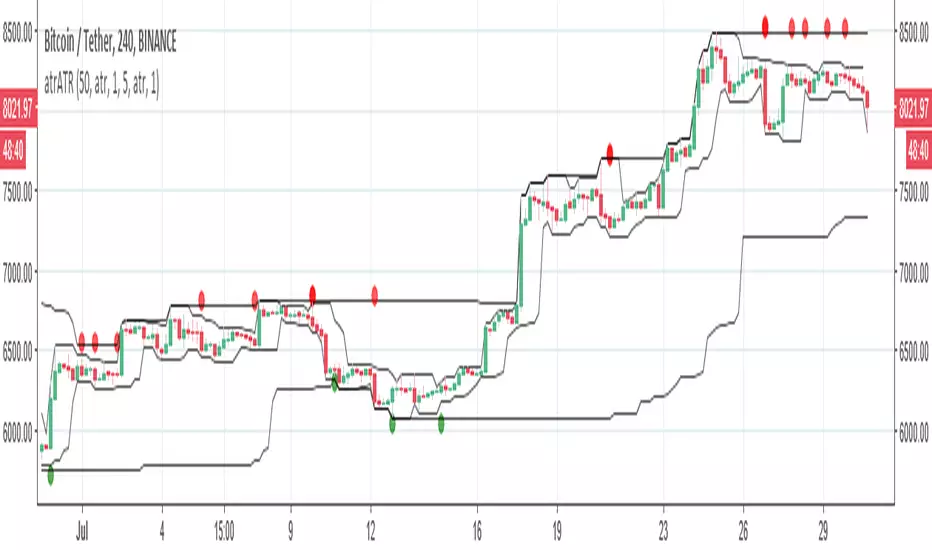
so this easy to see indicator based on ATR and donochian channel
there is fast and there is slow channels . when they are kissing each other then either in the low point or high point is change of trend. for example: the price went to high point and the fast channel is departing down from the slow this is time to sell.
the opposite when the fast channel departing up from the slow channel
it the same mechanism of the linear regression just more accurate.
the circles are just point where ATR think it time to buy or sell. but this is easy way to think on trends and to figure out if you going short or long
受保护脚本
此脚本以闭源形式发布。 但是,您可以自由使用,没有任何限制 — 了解更多信息这里。
免责声明
这些信息和出版物并非旨在提供,也不构成TradingView提供或认可的任何形式的财务、投资、交易或其他类型的建议或推荐。请阅读使用条款了解更多信息。
受保护脚本
此脚本以闭源形式发布。 但是,您可以自由使用,没有任何限制 — 了解更多信息这里。
免责声明
这些信息和出版物并非旨在提供,也不构成TradingView提供或认可的任何形式的财务、投资、交易或其他类型的建议或推荐。请阅读使用条款了解更多信息。