PROTECTED SOURCE SCRIPT
已更新 [N]RSIOMA - eXtremis

RSIOMA Indicator
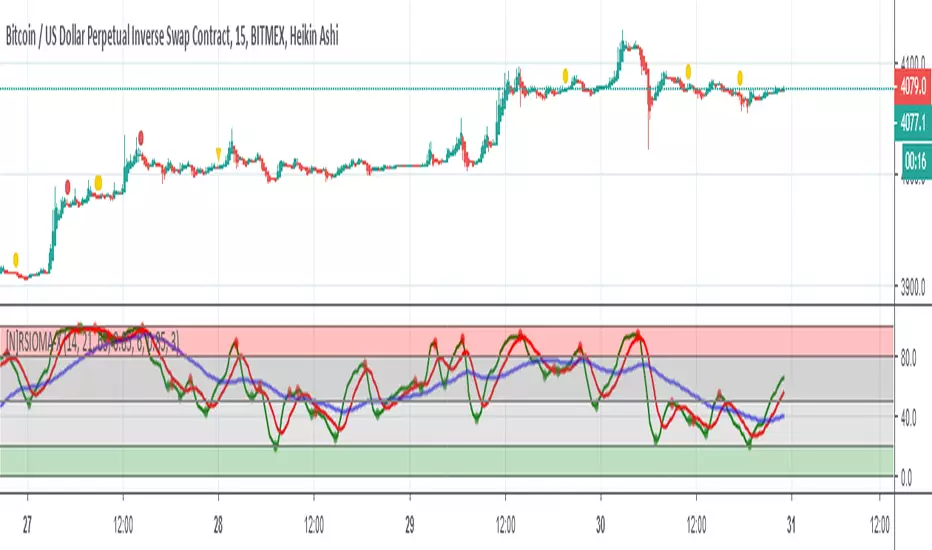
This indicator takes two moving averages, calculates their RSI (Relative Strength Index) and then also adds a moving average of the calculated RSI. These two lines now can accurately signal the trend changes.
RSIOMA eXtremis is based on ALMA (Arnaud Legoux Moving Average)
- Why ALMA?
- The Arnaud Legoux moving average applies the moving average twice, once from left to right and the other from right from left with the process said to eliminate price lag or phase shift significantly,
a problem that is common to the traditional moving averages.
[u]About ALMA[/u]
Offset: The offset value is used to tweak the ALMA to be more inclined towards responsiveness or smoothness. The offset can be set in decimals between 0 and 1. A setting of 0.99 makes the ALMA extremely responsive, while a value of 0.01 makes it very smooth.
Sigma: The sigma setting is a parameter used for the filter. A setting of 6 makes the filter rather large while a smaller sigma setting makes it more focused.
[u]About Market Base[/u]
It shows the overall direction of the market. The overall market has a tendency to do two things. It can turn slowly, or it can continue to go in the initial direction. This is because it’s too big and it can’t turn too quickly.
About Divergences
Regular Divergence - regular divergence is a sign of trend reversal.
Hidden Divergence - hidden divergence is a sign of trend continuation
RSIOMA eXtremis can detect all types.
[u]HOW TO TRADE[/u]
- Look out for bounces. When RSI line bounces off from MA line it means the trend will likely continue;
- Look out for support / resistance of RSI LINE.
- Look out for Market Base Line, it can be used to determine the long-term trend.
- 20 - 80 levels are important
- Green > Red = Long
- Red > Green = Short
- Green > Red > Market Base = you can go long for a while
- Red > Green > Market Base = you can go short for a while
- Green & Red bounce from Market Base = initial trend will continue
- Look out for divergences
- Look out for retests after bounces
- Look out for those tiny dots!! Those can tell you a great story. ;)
Try different settings for your strategy
[u]MAY THE % BE WITH YOU![/u]
版本注释
Colors added to easily spot Buy and Sell zones Green Zone = Strong Buy
Gray Zone 1 = Neutral Zone - trade careful
Gray Zone 2 = Neutral Zone - trade careful
Red Zone = Strong Sell
受保护脚本
此脚本以闭源形式发布。 但是,您可以自由使用,没有任何限制 — 了解更多信息这里。
免责声明
这些信息和出版物并非旨在提供,也不构成TradingView提供或认可的任何形式的财务、投资、交易或其他类型的建议或推荐。请阅读使用条款了解更多信息。
受保护脚本
此脚本以闭源形式发布。 但是,您可以自由使用,没有任何限制 — 了解更多信息这里。
免责声明
这些信息和出版物并非旨在提供,也不构成TradingView提供或认可的任何形式的财务、投资、交易或其他类型的建议或推荐。请阅读使用条款了解更多信息。