OPEN-SOURCE SCRIPT
Volume Pressure Bars
Description
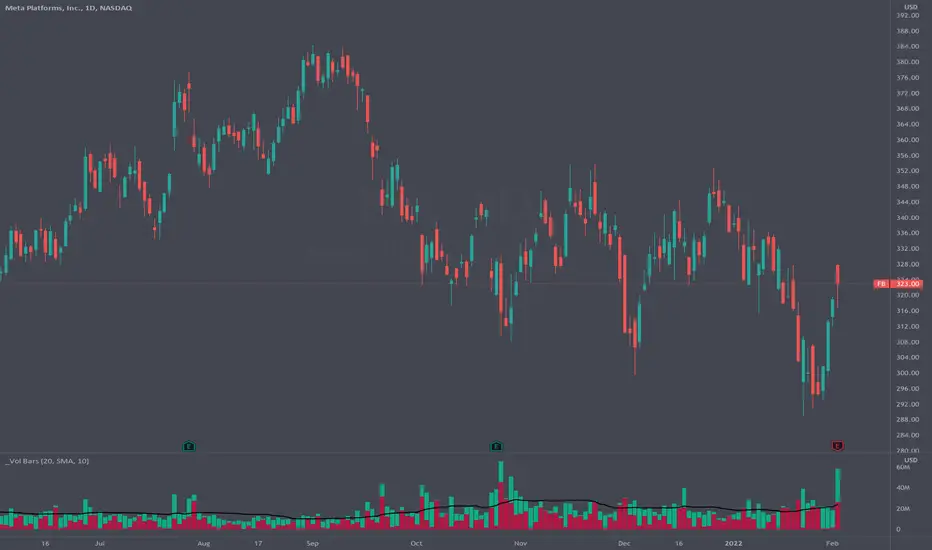
This indicator transforms the normal volume bars into buying and selling segments. This allows the user to easily see how much buying and selling pressure is occurring on any given timeframe. The buying and selling pressure values are calculated using the following equations:
buyingPressure = volume * (close - low) / (high - low)
sellingPressure = volume * (high - close) / (high - low)
Moving Average Line
Also included in this indicator is the optional moving average line. This allows the user to easily see if volume is above or below the average line. All aspects of the moving average line can be adjusted. The line can be toggled on & off, the length of the moving average can be adjusted, the mathematical smoothing function can be chosen, and the color & style of the line can be configured.
Scaling
If the volume pressure bars are displayed on the same “pane” as the price candles, then the volume bars can be scaled up or down. In the Input settings check the “Scale Bars” checkbox. Then increase the “Scaling Factor” number to make all of the volume bars smaller (to allow more room on your chart) or decrease the number to make the volume bars bigger.
IMPORTANT NOTE #1: scaling only works when the volume pressure bars are in the same pane as the price candles. If the volume pressures bars are in their own pane, then the “Scale Bars” toggle has no effect.
IMPORTANT NOTE #2: if the volume pressure bars are in the same pane as the price candles then there will be a sizable gap between the bottom of the volume bars and the time axis on the TradingView chart. This IS NOT a bug in this indicators code. The gap IS a bug in the TradingView platform that affects all volume indicators besides the default volume indicator that comes with each blank chart. To remove the gap then move the “_Vol Bars” indicator to its own pane above or below the main pain.
Volume Numbers
In Pine Script there is not a true stacked bar chart plot. What the author has to use are multiple bar charts that are in front and behind each other. This gives the impression that the bars are truly stacked because the selling pressure is always smaller than the total volume on any given bar. There is no issue to visually look at the bars and see their heights but if the user used their cursor to hover on a bar to get the actual volume pressure values it leads to issues. To address this problem the author has created a third invisible bar called “Buy Vol Label” that is the buy pressure volume value. Thus when the user hovers the cursor over a bar the first value (from left to right) is the total volume for the bar, the second value is the sell pressure, the third value is the buy pressure, and the fourth value (if toggled on) is the moving average value.
开源脚本
秉承TradingView的精神,该脚本的作者将其开源,以便交易者可以查看和验证其功能。向作者致敬!您可以免费使用该脚本,但请记住,重新发布代码须遵守我们的网站规则。
免责声明
这些信息和出版物并非旨在提供,也不构成TradingView提供或认可的任何形式的财务、投资、交易或其他类型的建议或推荐。请阅读使用条款了解更多信息。
开源脚本
秉承TradingView的精神,该脚本的作者将其开源,以便交易者可以查看和验证其功能。向作者致敬!您可以免费使用该脚本,但请记住,重新发布代码须遵守我们的网站规则。
免责声明
这些信息和出版物并非旨在提供,也不构成TradingView提供或认可的任何形式的财务、投资、交易或其他类型的建议或推荐。请阅读使用条款了解更多信息。