OPEN-SOURCE SCRIPT
Same Day Past Candles
Same-Day Past Candles
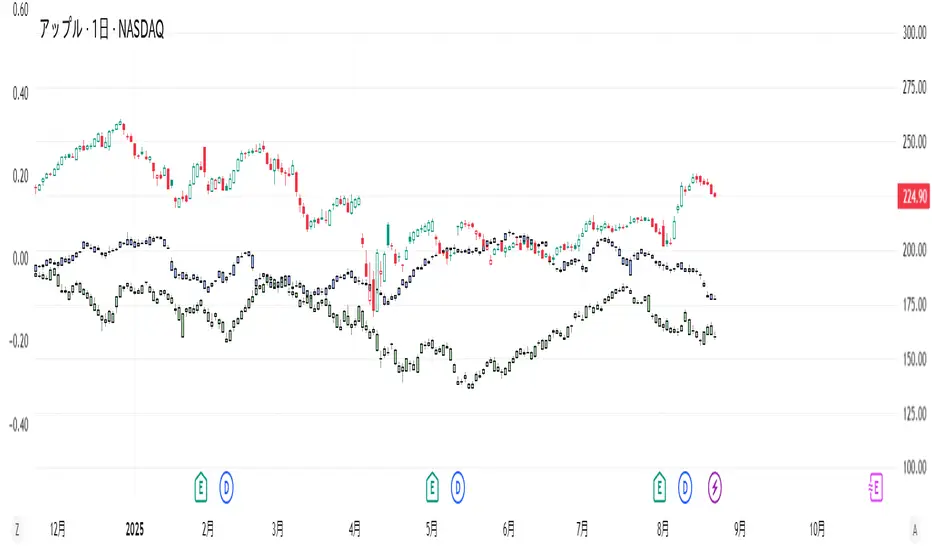
This indicator is a tool that plots the shapes of the candles from the same date one and two years ago directly on the current chart. By visually comparing past price movements, it can help you analyze seasonality and cyclical patterns.

Key Features
Plots Past Candles: Displays candles from the same date one and two years ago on your current chart.
Toggle Visibility: You can individually turn the display of the "1 year ago candle" and "2 years ago candle" on or off in the indicator's settings.
Candle Shape: The open, high, low, and close prices of the past candles are plotted, scaled to the current price range.
How to Use
Add this indicator to a daily chart for best results. The plotted candles are slightly offset upwards so they don't overlap with the current price, making it easier to compare the shape of the past candles with the current chart movement.
Visually checking how specific past price changes are reflected on the same day this year can provide insights for your trading strategy.
[Important Notice]
I do not speak English at all. Please understand that if you send me a message, I may not be able to reply, or my reply may have a different meaning. Thank you for your understanding.
This indicator is a tool that plots the shapes of the candles from the same date one and two years ago directly on the current chart. By visually comparing past price movements, it can help you analyze seasonality and cyclical patterns.
Key Features
Plots Past Candles: Displays candles from the same date one and two years ago on your current chart.
Toggle Visibility: You can individually turn the display of the "1 year ago candle" and "2 years ago candle" on or off in the indicator's settings.
Candle Shape: The open, high, low, and close prices of the past candles are plotted, scaled to the current price range.
How to Use
Add this indicator to a daily chart for best results. The plotted candles are slightly offset upwards so they don't overlap with the current price, making it easier to compare the shape of the past candles with the current chart movement.
Visually checking how specific past price changes are reflected on the same day this year can provide insights for your trading strategy.
[Important Notice]
I do not speak English at all. Please understand that if you send me a message, I may not be able to reply, or my reply may have a different meaning. Thank you for your understanding.
开源脚本
秉承TradingView的精神,该脚本的作者将其开源,以便交易者可以查看和验证其功能。向作者致敬!您可以免费使用该脚本,但请记住,重新发布代码须遵守我们的网站规则。
The Leap 1000位以内2回
The Leap Top 1000 Rank (x2), currently Top 1500.
(Mostly luck, though!)
AI Assessment: A Professional Whose Obsession Has Evolved into Instinct
だそーです
The Leap Top 1000 Rank (x2), currently Top 1500.
(Mostly luck, though!)
AI Assessment: A Professional Whose Obsession Has Evolved into Instinct
だそーです
免责声明
这些信息和出版物并非旨在提供,也不构成TradingView提供或认可的任何形式的财务、投资、交易或其他类型的建议或推荐。请阅读使用条款了解更多信息。