OPEN-SOURCE SCRIPT
Vertical Lines Overlay

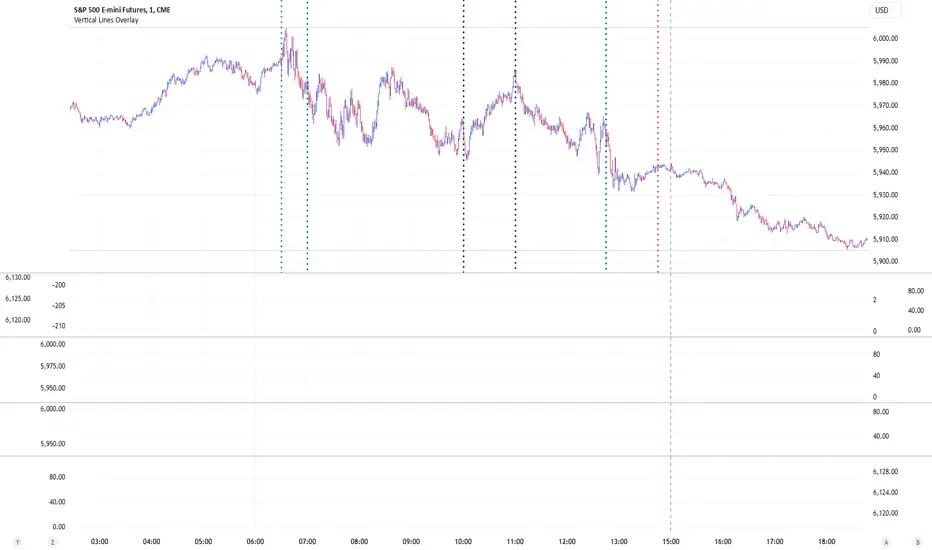
Vertical Lines Overlay with Custom Time Inputs
This script allows users to draw vertical lines on their charts at specific times of the day, providing a customizable tool for marking key events, session changes, or any other time-based analysis.
Features:
Customizable Time Inputs: Set up to 6 distinct times (hours and minutes) to draw vertical lines.
Line Style Options: Choose between solid, dotted, or dashed line styles for each line.
Line Width Control: Adjust the thickness of each line individually.
Color Selection: Assign unique colors to each vertical line for better visibility and organization.
Dynamic Time Offsets: Adjust line positions with predefined time offsets, ensuring compatibility across different trading instruments and time zones.
Automatic Line Drawing: Lines are plotted automatically at the specified times if the conditions are met.
How to Use:
Open the settings panel by clicking the gear icon.
Enable or disable each line by toggling the respective checkboxes.
Set the desired time for each line using the hour and minute inputs.
Customize line styles, widths, and colors for each line.
Optionally, apply a time offset based on your trading instrument or preference.
开源脚本
秉承TradingView的精神,该脚本的作者将其开源,以便交易者可以查看和验证其功能。向作者致敬!您可以免费使用该脚本,但请记住,重新发布代码须遵守我们的网站规则。
免责声明
这些信息和出版物并非旨在提供,也不构成TradingView提供或认可的任何形式的财务、投资、交易或其他类型的建议或推荐。请阅读使用条款了解更多信息。
开源脚本
秉承TradingView的精神,该脚本的作者将其开源,以便交易者可以查看和验证其功能。向作者致敬!您可以免费使用该脚本,但请记住,重新发布代码须遵守我们的网站规则。
免责声明
这些信息和出版物并非旨在提供,也不构成TradingView提供或认可的任何形式的财务、投资、交易或其他类型的建议或推荐。请阅读使用条款了解更多信息。