INVITE-ONLY SCRIPT
LVOLA MODEL

Another variant of the VOLA Model Range.
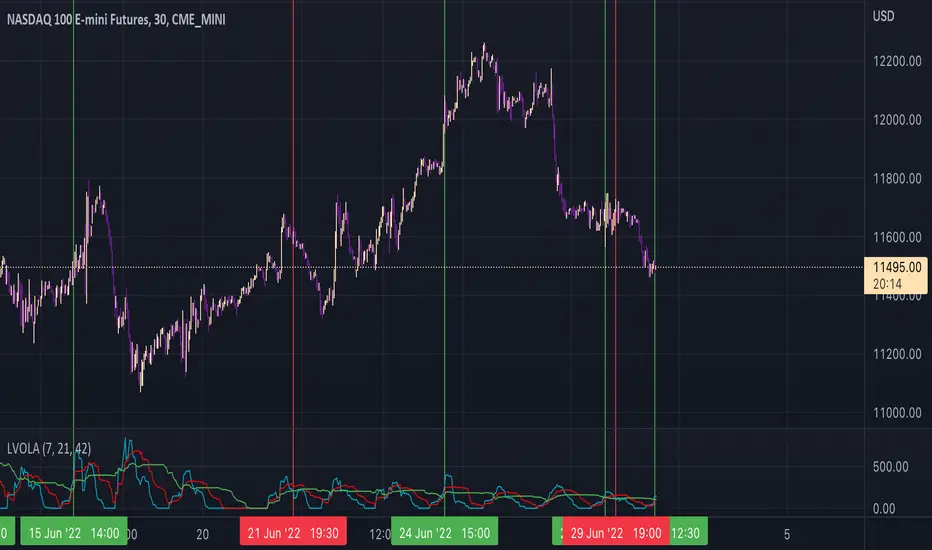
To use this script which focusses on vol on the given equity/commodity/price pair its focussed on at its core methodology. We use NQ1 here as an example on how this indicator can be used. Note the red lines indicate where buy signals occurred an example listed below. Note the best timeframes to use this indicator include (intraday - 1d trades) 7min, 30min, 1hr and Daily for multi day trades. This can be used in conjunction with MVEX VOLA, VOLA & ZVOLA (especially so) when looking to trade NQ/ ES QQQ / SPY use this in conjunction with the other VOLA models to confirm whether a buy/sell signal. This can also be used on equities since total flows in the bond market can help dictate movement in equities.
This is distilled into a simple method where you can use this indicator to gauge a potential buy or sell signal. The red shows a sell signal and a green which is a buy i.e. when the blue line short term signal (blue line) has a major divergence vs the mid and long term then this is typically a sell signal. This is shown in the chart above.
The green lines indicate where buy signals occurred with an example listed below.
The same goes for the reverse where the short term signal (blue line) is higher then we have a view of a potential buy signal.
Once again when the VVS (Short term signal) is flattened out then we have a slowing done in the movement of price action and a reversion has the potential to occur. The greater the divergence and when the line blue line flat lines i.e. stops going up or down and is separate from the green and the red, you then have a view to take a long (if above green and red with a large gap) and a sell (when blue is below green and red with a large gap).
Once again there are times where the signal will not work, as with every indicator, model etc nothing hits 100% and I doubt there ever will be such an indicator to exist. As with everything please manage your risk.
To use this script which focusses on vol on the given equity/commodity/price pair its focussed on at its core methodology. We use NQ1 here as an example on how this indicator can be used. Note the red lines indicate where buy signals occurred an example listed below. Note the best timeframes to use this indicator include (intraday - 1d trades) 7min, 30min, 1hr and Daily for multi day trades. This can be used in conjunction with MVEX VOLA, VOLA & ZVOLA (especially so) when looking to trade NQ/
This is distilled into a simple method where you can use this indicator to gauge a potential buy or sell signal. The red shows a sell signal and a green which is a buy i.e. when the blue line short term signal (blue line) has a major divergence vs the mid and long term then this is typically a sell signal. This is shown in the chart above.
The green lines indicate where buy signals occurred with an example listed below.
The same goes for the reverse where the short term signal (blue line) is higher then we have a view of a potential buy signal.
Once again when the VVS (Short term signal) is flattened out then we have a slowing done in the movement of price action and a reversion has the potential to occur. The greater the divergence and when the line blue line flat lines i.e. stops going up or down and is separate from the green and the red, you then have a view to take a long (if above green and red with a large gap) and a sell (when blue is below green and red with a large gap).
Once again there are times where the signal will not work, as with every indicator, model etc nothing hits 100% and I doubt there ever will be such an indicator to exist. As with everything please manage your risk.
免责声明
这些信息和出版物并不意味着也不构成TradingView提供或认可的金融、投资、交易或其它类型的建议或背书。请在使用条款阅读更多信息。