OPEN-SOURCE SCRIPT
RSI OverBought/Sold Price Predict
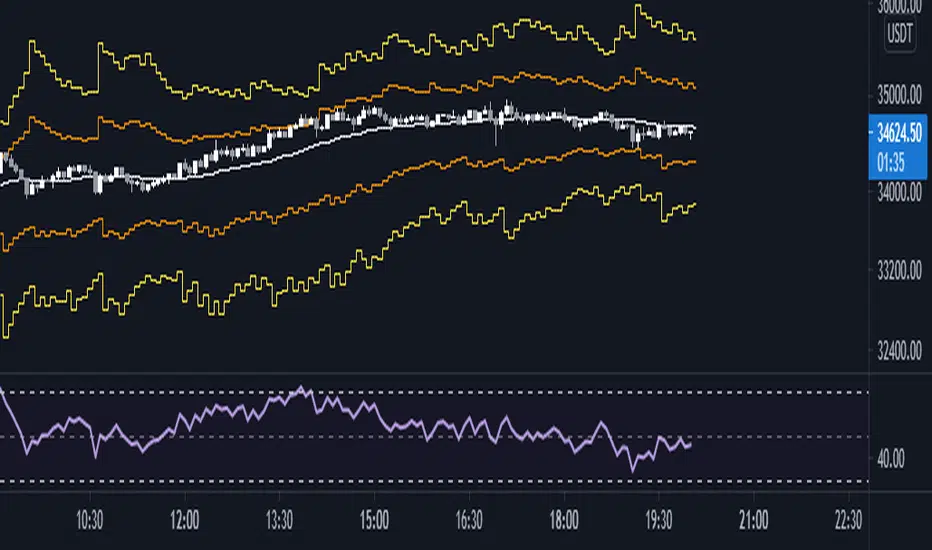
Using the RSI formula, predict what price should be next to be oversold or overbought.
For using support and resistance, turn on "smoothing" option.
White Line = what price should be next to be RSI = 50.
Orange Line = what price should be next to be RSI = 70 or 30 (Default)
Yellow Line = what price should be next to be RSI = 80 or 20 (Default)
Green Line = what price should be next to be RSI = 90 or 10 (Default)
开源脚本
秉承TradingView的精神,该脚本的作者将其开源,以便交易者可以查看和验证其功能。向作者致敬!您可以免费使用该脚本,但请记住,重新发布代码须遵守我们的网站规则。
免责声明
这些信息和出版物并非旨在提供,也不构成TradingView提供或认可的任何形式的财务、投资、交易或其他类型的建议或推荐。请阅读使用条款了解更多信息。
开源脚本
秉承TradingView的精神,该脚本的作者将其开源,以便交易者可以查看和验证其功能。向作者致敬!您可以免费使用该脚本,但请记住,重新发布代码须遵守我们的网站规则。
免责声明
这些信息和出版物并非旨在提供,也不构成TradingView提供或认可的任何形式的财务、投资、交易或其他类型的建议或推荐。请阅读使用条款了解更多信息。