INVITE-ONLY SCRIPT
High Volume Key Hidden Level
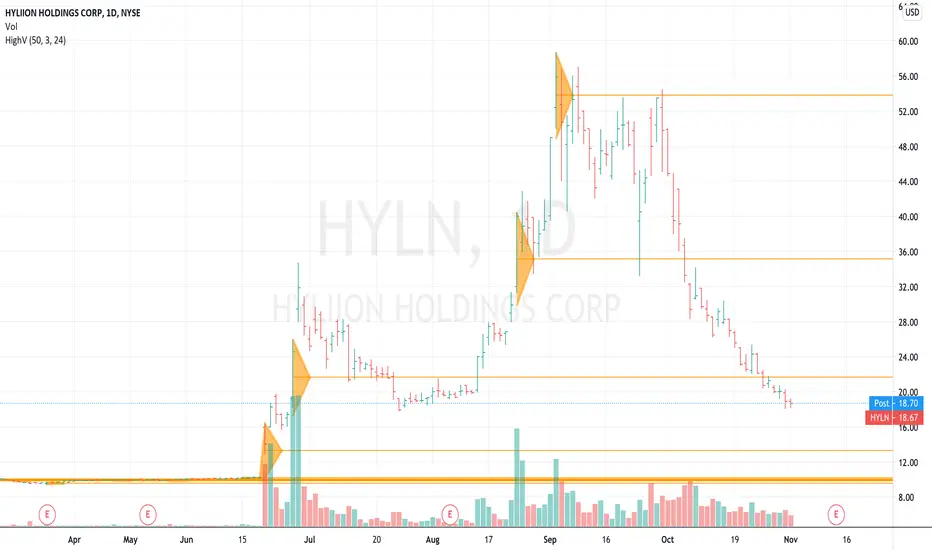
There are important price levels in the market that occur when high volumes of trading occur. The indicator is set to look for periods where there is 3x's the 50-period average volume and then it graphs a horizontal line going forward in time for reference as support or resistance.
Generally speaking, if the market rallies into a line then look for the market to stall at the line as it is a level of supply. Likewise, if the market falls down to a high volume level, then it would be logical to assume there is support at that level especially on the first and second revisit.
The indicator is adjustable so you can filter out to whatever multiple of any average. Some markets rarely have 3-times volume events, so you may have to adjust for each symbol.
High volume events indicate that news or an event has occured and should mark an important level where traders and investors may be interested in trading at that level again.
I would consider an uptrend to be in tact when the market is above the latest "high volume bar" and in a downtrend when the market is under the latest "high volume bar".
We use green triangles to plot earnings-release dates and blue triangles for dividends, yellow triangles for range expansion moves and black triangles for emotions (good and bad emotions such has fear and excitement).
Subscribe to my indicator package KEY HIDDEN LEVELS $10/mo or $100/year and join me in the trading room KEY HIDDEN LEVELS here at TradingView.com
免责声明
这些信息和出版物并不意味着也不构成TradingView提供或认可的金融、投资、交易或其它类型的建议或背书。请在使用条款阅读更多信息。
免责声明
这些信息和出版物并不意味着也不构成TradingView提供或认可的金融、投资、交易或其它类型的建议或背书。请在使用条款阅读更多信息。