PROTECTED SOURCE SCRIPT
EMA/SMA Cross +

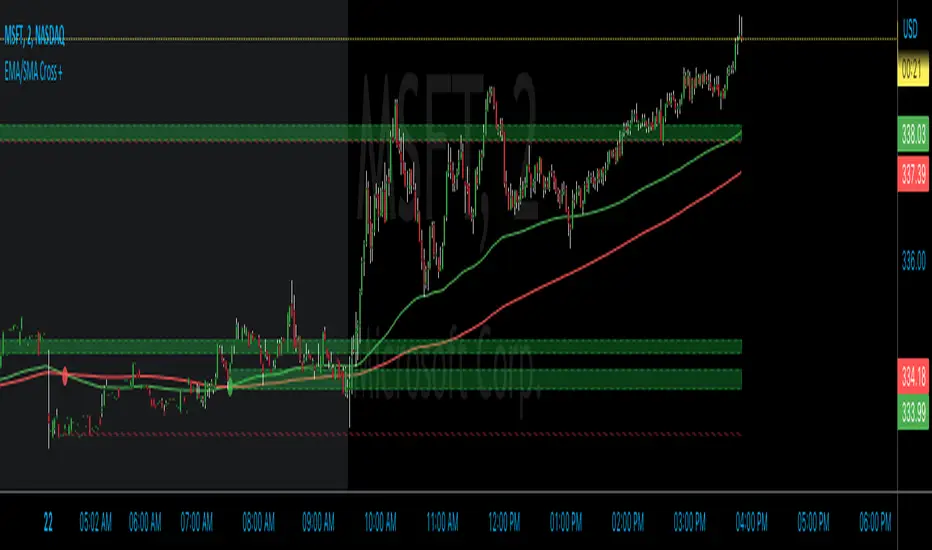
Introducing the EMA/SMA Cross +, a powerful and customizable indicator designed specifically for TradingView. This indicator is unlike any other, as it combines the strengths of both Exponential Moving Average (EMA) and Simple Moving Average (SMA) in conjunction with supply and demand zones to provide you with a comprehensive understanding of price action. The EMA/SMA Cross + is perfect for traders looking for an edge in the market.
How it works:
The EMA/SMA Cross + indicator utilizes two moving averages: a short-term EMA and a long-term SMA. The short-term EMA is calculated using a user-defined length (default: 120) and the closing prices of the selected timeframe. Similarly, the long-term SMA is calculated using a user-defined length (default: 200) and the closing prices of the selected timeframe. These moving averages are then plotted on the chart along with their respective crosses.
When the short-term EMA crosses above the long-term SMA, it signals a bullish trend, and a green circle appears on the chart. Conversely, when the short-term EMA crosses below the long-term SMA, it signals a bearish trend, and a red circle appears on the chart.
Supply and Demand Zones:
In addition to the moving average crosses, the EMA/SMA Cross + indicator also displays supply and demand zones. These zones are created whenever a cross occurs, representing areas where the price is likely to reverse or consolidate. The supply zones (bullish) are displayed as green dashed boxes, while the demand zones (bearish) are displayed as red dashed boxes.
To use these zones in conjunction with price action, traders can look for potential entry points when the price approaches a zone. For example, if the price is approaching a bullish supply zone, traders may consider entering a long position, anticipating a potential upward price movement. On the other hand, if the price is approaching a bearish demand zone, traders may consider entering a short position, anticipating a potential downward price movement.
The EMA/SMA Cross + indicator sets itself apart from other TradingView indicators with its distinctive blend of features and customization options. Users can effortlessly modify the following:
TimeFrame: Adjust the higher time frame used for the calculations.
Length: Customize the length of the EMA and SMA.
Display last X zones: Limit the number of displayed zones to the most recent ones.
Colors: Personalize the colors of bullish circles, bearish circles, supply boxes, and demand boxes.
Uniqueness and Code Protection
The EMA/SMA Cross + indicator stands out from other TradingView indicators due to its unique combination of EMA and SMA, along with the integration of supply and demand zones. This innovative approach provides a comprehensive view of the market, allowing traders to make more informed decisions.
Please note that the code for this script is protected to maintain its uniqueness and ensure that it remains exclusive to our users.
受保护脚本
此脚本以闭源形式发布。 但是,您可以自由使用,没有任何限制 — 了解更多信息这里。
免责声明
这些信息和出版物并非旨在提供,也不构成TradingView提供或认可的任何形式的财务、投资、交易或其他类型的建议或推荐。请阅读使用条款了解更多信息。
受保护脚本
此脚本以闭源形式发布。 但是,您可以自由使用,没有任何限制 — 了解更多信息这里。
免责声明
这些信息和出版物并非旨在提供,也不构成TradingView提供或认可的任何形式的财务、投资、交易或其他类型的建议或推荐。请阅读使用条款了解更多信息。