OPEN-SOURCE SCRIPT
已更新 [NLR] - SweetSpot Zones
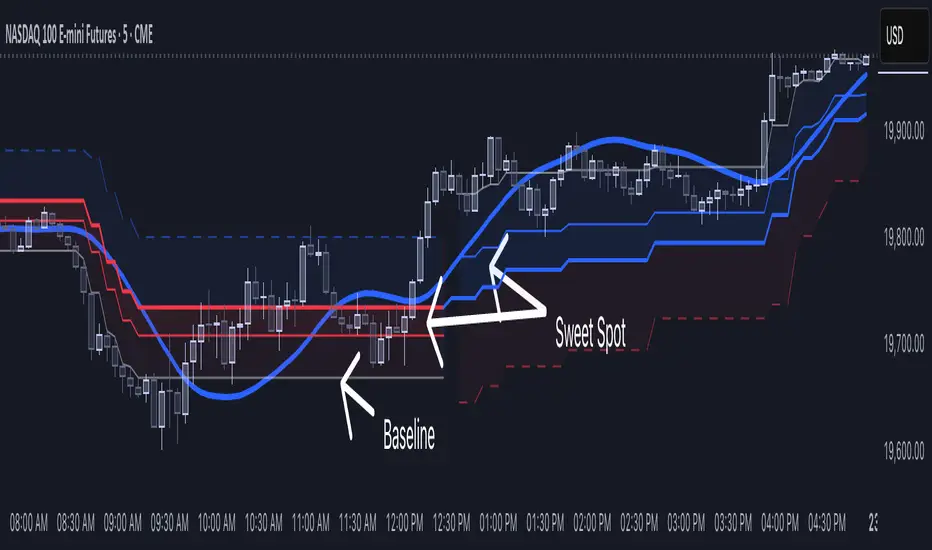
The Sweet Spot Zone helps you find the best spots to enter a trade, inspired by the "Follow Line Indicator" by Dreadblitz (big thanks to him!). It draws a colored zone on your chart to show ideal entry points, with a Base Point to keep you on track.
What It Does
How to Use It
Settings
Credits
Inspired by the "Follow Line Indicator" by Dreadblitz—check out his work for more great ideas!
What It Does
- Blue Zone: Uptrend—buy when the price dips into the zone.
- Red Zone: Downtrend—sell or short when the price climbs into the zone.
- Base Point: A gray line showing the key level the zone is built on.
How to Use It
- Look for the colored zone:
- Blue: Buy if the price dips into the zone but stays above the Base Point.
- Red: Sell/short if the price climbs into the zone but stays below the Base Point. - Important: Avoid entering trade beyond base point - you might see low returns and face big drawdowns.
- Confirm with other signals (like RSI/MACD) before entering.
Settings
- ATR Length (10): How far back it looks to calculate price movement.
- ATR Multiplier (2.5): How wide the zone is.
- Error Margin (5.0): Keeps the zone steady during small price wiggles.
- Uptrend/Downtrend Colors: Change the zone colors if you’d like!
Credits
Inspired by the "Follow Line Indicator" by Dreadblitz—check out his work for more great ideas!
版本注释
Added other side zone to show possible area where price action may go开源脚本
秉承TradingView的精神,该脚本的作者将其开源,以便交易者可以查看和验证其功能。向作者致敬!您可以免费使用该脚本,但请记住,重新发布代码须遵守我们的网站规则。
免责声明
这些信息和出版物并非旨在提供,也不构成TradingView提供或认可的任何形式的财务、投资、交易或其他类型的建议或推荐。请阅读使用条款了解更多信息。
开源脚本
秉承TradingView的精神,该脚本的作者将其开源,以便交易者可以查看和验证其功能。向作者致敬!您可以免费使用该脚本,但请记住,重新发布代码须遵守我们的网站规则。
免责声明
这些信息和出版物并非旨在提供,也不构成TradingView提供或认可的任何形式的财务、投资、交易或其他类型的建议或推荐。请阅读使用条款了解更多信息。