PROTECTED SOURCE SCRIPT
已更新 VIPER DOPING - A Volume Profile to estimate trend probability

DESCRIPTION:
VIPER DOPING uses volume analysis to help trader to understand trading keys below:
HOW TO USE:
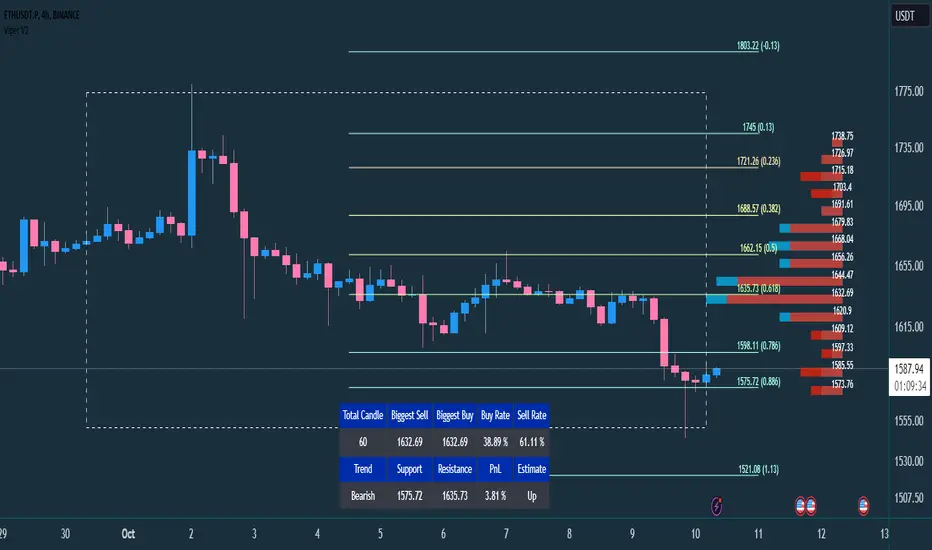
The volume bar will have buy and sell colors, by default the buy color is blue and the sell is red. The size of bar is important matter, the biggest bar size means that price level has strong volume or transaction and the smallest bar size indicates the lowest transaction or volume. How to read it?
Trading style and the maximum range (total candle), default is 60. This setup to analyze volumes in specific candle range. Please check the following recommendation based on trading style:
The white box is to visualize trading area by total candle. Every line has the meaning:
The fibonacci line will help you to confirm and compare of supports and resistances with the volume profile lines.
The TABLE CELLS
it contains information to help trader to understand the recent situation of market and to take strategy of trading:
CONFIGURATION:
VIPER DOPING uses volume analysis to help trader to understand trading keys below:
- Support and Resistance
- Profit and Loss
- Estimate candle direction
- Trend
- Biggest Buy and Sell on level prices
HOW TO USE:
The volume bar will have buy and sell colors, by default the buy color is blue and the sell is red. The size of bar is important matter, the biggest bar size means that price level has strong volume or transaction and the smallest bar size indicates the lowest transaction or volume. How to read it?
- The bar above the candle is the resistance
- The bar below the candle is the support
- If you want long the market, find the biggest or bigger support, which is below the candle
- If you want short the market, find the biggest or bigger resistance which is above the candle
Trading style and the maximum range (total candle), default is 60. This setup to analyze volumes in specific candle range. Please check the following recommendation based on trading style:
- Scalping: 30 - 60 candles, recommendation timeframe: 5m - 1h
- Day Trading: 50 - 120 candles, recommendation timeframe: 30m - 4h
- Swing Trading: 100- 240 candles, recommendation timeframe: 1h- 3D
The white box is to visualize trading area by total candle. Every line has the meaning:
- The left line is the start candle
- The right line is the end candle
- The top line is the highest price of volume profile
- The bottom line is the lowest price of volume profile
The fibonacci line will help you to confirm and compare of supports and resistances with the volume profile lines.
The TABLE CELLS
it contains information to help trader to understand the recent situation of market and to take strategy of trading:
- Total Candle: the maximum candles are used to analyze the volume from previous active candle
- Biggest Sell: the horizontal price area which has the largest of sell volume of the last total candle
- Biggest Buy: the horizontal price area which has the largest of buy volume of the last total candle
- Buy Rate: the ratio of buy and sell volume of the last total candle
Support: the closest price to be the support from the active candle, auto changed if support to be invalid - Resistance: the closest price to be the resistance from the active candle, auto changed if support to be invalid
- PnL: the percentage profit if you trade using the support and resistance prices and it can be used for Risk Management. Wisely the risk is 50% of the profit, example if the profit 1% the your risk should be 0.5% from entry.
- Estimate: to analize the next direction of candle or target, it will be changed automatically by volume condition.
CONFIGURATION:
- Table Position: You can change the table position to top or bottom, to left, right or center
- Calculation: You can include the active candle in volume calculation or you can choose the behind active candle. If you use active candle, there could be possible repainting.
- The volume profile configuration is about appearance configuration, to setup the thickness, colors, position.
- The fibonacci configuration is about appearance configuration, to setup the thickness, extend lines, label styles.
版本注释
Update indicator title and bugfix estimate direction code受保护脚本
此脚本以闭源形式发布。 但是,您可以自由使用,没有任何限制 — 了解更多信息这里。
免责声明
这些信息和出版物并非旨在提供,也不构成TradingView提供或认可的任何形式的财务、投资、交易或其他类型的建议或推荐。请阅读使用条款了解更多信息。
受保护脚本
此脚本以闭源形式发布。 但是,您可以自由使用,没有任何限制 — 了解更多信息这里。
免责声明
这些信息和出版物并非旨在提供,也不构成TradingView提供或认可的任何形式的财务、投资、交易或其他类型的建议或推荐。请阅读使用条款了解更多信息。