INVITE-ONLY SCRIPT
已更新 CandelaCharts - ICT Daily Profiles
📝 Overview
The ICT Daily Profiles by CandelaCharts rooted in the ICT teachings represent a pattern-based approach to trading that focuses on identifying and analyzing the key highs and lows of various intraday trading sessions.
The toolkit automatically detects and marks these ICT Daily Profiles on the chart, enabling traders to quickly pinpoint critical zones for analysis and decision-making.
Whether you are a seasoned professional or a developing trader, ICT Daily Profiles provides actionable frameworks to enhance your understanding of price dynamics and improve your intraday trading performance.
📦 Features
The ICT Daily Profiles toolkit offers a comprehensive set of features designed to enhance trading precision and decision-making. Key features include:
The indicator supports the following profiles:
⚙️ Settings
⚡️ Showcase
ICT (Inner Circle Trader) daily profile templates are analytical frameworks that categorize and describe typical patterns of price action observed during a trading day.
ICT Daily Profiles

Scanner

📒 Usage
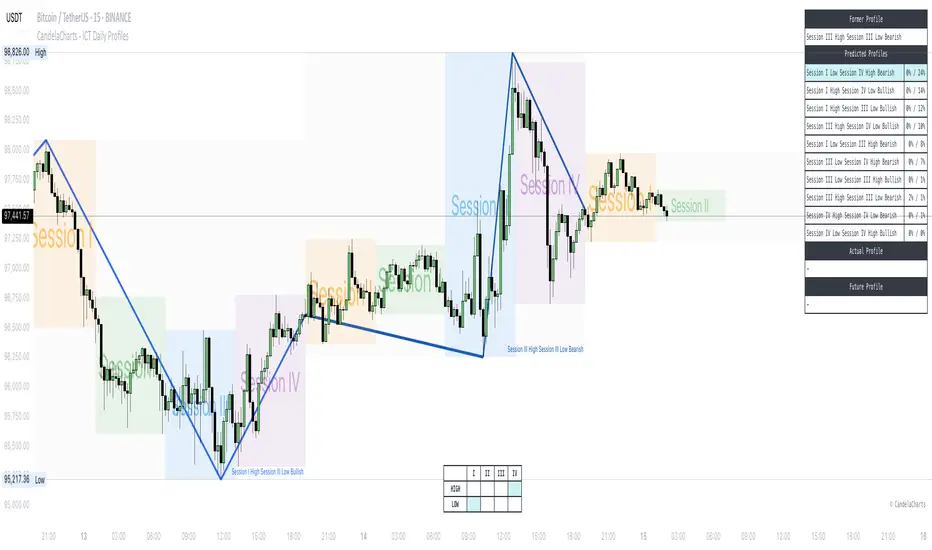
The ICT Daily Profiles indicator aims to give traders a clear and actionable view of the Daily Previous, Current, and Future Profiles. This enables them to analyze market structure, predict price movements, and align their trading strategies with higher time-frame trends.
Predicted Profiles represent all potential scenarios for the current day, generated by a profile detection algorithm.
By visualizing potential outcomes through Predicted Profiles, the ICT Daily Profiles indicator provides traders with a strategic edge, allowing them to remain flexible, prepared, and aligned with the most probable market movements.
🚨 Alerts
The indicator does not provide any alerts!
🔹 Notes
ICT Daily Profiles
pbs.twimg.com/media/Ghb-WM8WwAAyjQF?format=jpg&name=4096x4096
⚠️ Disclaimer
These tools are exclusively available on the TradingView platform.
Our charting tools are intended solely for informational and educational purposes and should not be regarded as financial, investment, or trading advice. They are not designed to predict market movements or offer specific recommendations. Users should be aware that past performance is not indicative of future results and should not rely on these tools for financial decisions. By using these charting tools, the purchaser agrees that the seller and creator hold no responsibility for any decisions made based on information provided by the tools. The purchaser assumes full responsibility and liability for any actions taken and their consequences, including potential financial losses or investment outcomes that may result from the use of these products.
By purchasing, the customer acknowledges and accepts that neither the seller nor the creator is liable for any undesired outcomes stemming from the development, sale, or use of these products. Additionally, the purchaser agrees to indemnify the seller from any liability. If invited through the Friends and Family Program, the purchaser understands that any provided discount code applies only to the initial purchase of Candela's subscription. The purchaser is responsible for canceling or requesting cancellation of their subscription if they choose not to continue at the full retail price. In the event the purchaser no longer wishes to use the products, they must unsubscribe from the membership service, if applicable.
We do not offer reimbursements, refunds, or chargebacks. Once these Terms are accepted at the time of purchase, no reimbursements, refunds, or chargebacks will be issued under any circumstances.
By continuing to use these charting tools, the user confirms their understanding and acceptance of these Terms as outlined in this disclaimer.
The ICT Daily Profiles by CandelaCharts rooted in the ICT teachings represent a pattern-based approach to trading that focuses on identifying and analyzing the key highs and lows of various intraday trading sessions.
The toolkit automatically detects and marks these ICT Daily Profiles on the chart, enabling traders to quickly pinpoint critical zones for analysis and decision-making.
Whether you are a seasoned professional or a developing trader, ICT Daily Profiles provides actionable frameworks to enhance your understanding of price dynamics and improve your intraday trading performance.
📦 Features
The ICT Daily Profiles toolkit offers a comprehensive set of features designed to enhance trading precision and decision-making. Key features include:
- Daily Profiles
- Advanced Styling
- Scanner
The indicator supports the following profiles:
- Session I High Session II Low Bearish
- Session I High Session III Low Bearish
- Session I High Session IV Low Bearish
- Session II High Session III Low Bearish
- Session II High Session IV Low Bearish
- Session III High Session IV Low Bearish
- Session I Low Session II High Bullish
- Session I Low Session III High Bullish
- Session I Low Session IV High Bullish
- Session II Low Session III High Bullish
- Session II Low Session IV High Bullish
- Session III Low Session IV High Bullish
- Session I High Session I Low Bearish
- Session I Low Session I High Bearish
- Session II High Session II Low Bearish
- Session II Low Session II High Bearish
- Session III High Session III Low Bearish
- Session III Low Session III High Bearish
- Session IV High Session IV Low Bearish
- Session IV Low Session IV High Bearish
⚙️ Settings
- Sessions: Controls how many sessions you want to see.
- History: Controls how many profiles are displayed on the chart.
- Timeframe Limit: Sets the timeframe up to which profiles will be drawn.
- Show OHLC Lines: Display the lines for OHLC.
- Show Profile Line: Display the Daily Profile line.
- Use NY Midnight Open: Controls from where a profile will start detection.
- Open: Style for Open line.
- High: Style for High line.
- Low: Style for Low line.
- Midline: Style for Profile Midline.
- Label: Controls the position of the Daily Profile name.
- Scanner: Display the Scanner
⚡️ Showcase
ICT (Inner Circle Trader) daily profile templates are analytical frameworks that categorize and describe typical patterns of price action observed during a trading day.
ICT Daily Profiles
Scanner
📒 Usage
The ICT Daily Profiles indicator aims to give traders a clear and actionable view of the Daily Previous, Current, and Future Profiles. This enables them to analyze market structure, predict price movements, and align their trading strategies with higher time-frame trends.
- Load the indicator on the chart
- Enable Scanner
- See the Predicted Profiles list
Predicted Profiles represent all potential scenarios for the current day, generated by a profile detection algorithm.
By visualizing potential outcomes through Predicted Profiles, the ICT Daily Profiles indicator provides traders with a strategic edge, allowing them to remain flexible, prepared, and aligned with the most probable market movements.
🚨 Alerts
The indicator does not provide any alerts!
🔹 Notes
ICT Daily Profiles
pbs.twimg.com/media/Ghb-WM8WwAAyjQF?format=jpg&name=4096x4096
⚠️ Disclaimer
These tools are exclusively available on the TradingView platform.
Our charting tools are intended solely for informational and educational purposes and should not be regarded as financial, investment, or trading advice. They are not designed to predict market movements or offer specific recommendations. Users should be aware that past performance is not indicative of future results and should not rely on these tools for financial decisions. By using these charting tools, the purchaser agrees that the seller and creator hold no responsibility for any decisions made based on information provided by the tools. The purchaser assumes full responsibility and liability for any actions taken and their consequences, including potential financial losses or investment outcomes that may result from the use of these products.
By purchasing, the customer acknowledges and accepts that neither the seller nor the creator is liable for any undesired outcomes stemming from the development, sale, or use of these products. Additionally, the purchaser agrees to indemnify the seller from any liability. If invited through the Friends and Family Program, the purchaser understands that any provided discount code applies only to the initial purchase of Candela's subscription. The purchaser is responsible for canceling or requesting cancellation of their subscription if they choose not to continue at the full retail price. In the event the purchaser no longer wishes to use the products, they must unsubscribe from the membership service, if applicable.
We do not offer reimbursements, refunds, or chargebacks. Once these Terms are accepted at the time of purchase, no reimbursements, refunds, or chargebacks will be issued under any circumstances.
By continuing to use these charting tools, the user confirms their understanding and acceptance of these Terms as outlined in this disclaimer.
版本注释
CandelaCharts - ICT Daily Profiles 1.0.1- Add support for dark mode
- Fix timezone related bug
版本注释
CandelaCharts - ICT Daily Profiles 1.0.2- Redesign predictive profiles dashboard
- Add predictive profile dashboard grid for better visualization
- Bug fixing
版本注释
CandelaCharts - ICT Daily Profiles 1.0.3- Add option to show/hide session name labels
- Bug fixing
仅限邀请脚本
只有作者授权的用户才能访问此脚本。您需要申请并获得使用许可。通常情况下,付款后即可获得许可。更多详情,请按照下方作者的说明操作,或直接联系CandelaCharts。
TradingView不建议您付费购买或使用任何脚本,除非您完全信任其作者并了解其工作原理。您也可以在我们的社区脚本找到免费的开源替代方案。
作者的说明
Explore all CandelaCharts indicators at: https://www.candelacharts.com/. Connect with our community on Discord: https://discord.gg/etGSTepqbu. All scripts and content provided by CandelaCharts are intended for informational and educational purposes only.
Get access to our exclusive tools: candelacharts.com
Join our community: discord.gg/etGSTepqbu
All content provided by CandelaCharts is for informational & educational purposes only.
Join our community: discord.gg/etGSTepqbu
All content provided by CandelaCharts is for informational & educational purposes only.
免责声明
这些信息和出版物并非旨在提供,也不构成TradingView提供或认可的任何形式的财务、投资、交易或其他类型的建议或推荐。请阅读使用条款了解更多信息。