PROTECTED SOURCE SCRIPT
NK-Macd + Rsi3
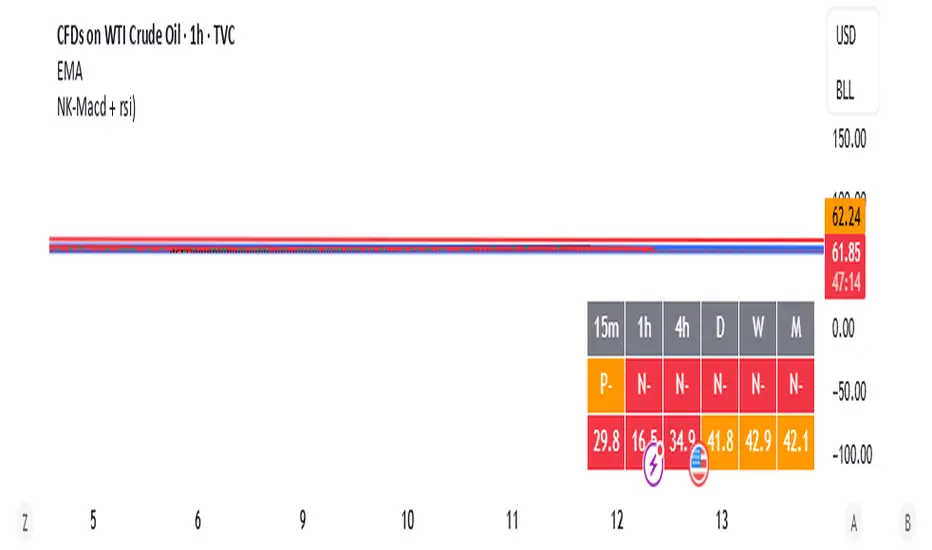
Here in one table you can see the MACD of the different time frame that what is the status of the MACD, is it above zero line or below zero line.
Second you will see in table that RSI number of all time frame, so here we dont need to go and check RSI by switching the chart and time frame.
at one place you will see both RSI and MACD, and by seeing the number you can check when the price in oversold zone and when it will in overbought also you can see the when the price in momentum and when not.
Example :- let assume RSI table showing above 40 in 1 hr and 67 in daily that means RSI is in swing momentum in hrly but momentum in daily.
受保护脚本
此脚本以闭源形式发布。 但是,您可以自由使用,没有任何限制 — 了解更多信息这里。
免责声明
这些信息和出版物并非旨在提供,也不构成TradingView提供或认可的任何形式的财务、投资、交易或其他类型的建议或推荐。请阅读使用条款了解更多信息。
受保护脚本
此脚本以闭源形式发布。 但是,您可以自由使用,没有任何限制 — 了解更多信息这里。
免责声明
这些信息和出版物并非旨在提供,也不构成TradingView提供或认可的任何形式的财务、投资、交易或其他类型的建议或推荐。请阅读使用条款了解更多信息。