OPEN-SOURCE SCRIPT
Chart Patterns Buy Alerts (Intraday) - Bullish Patterns
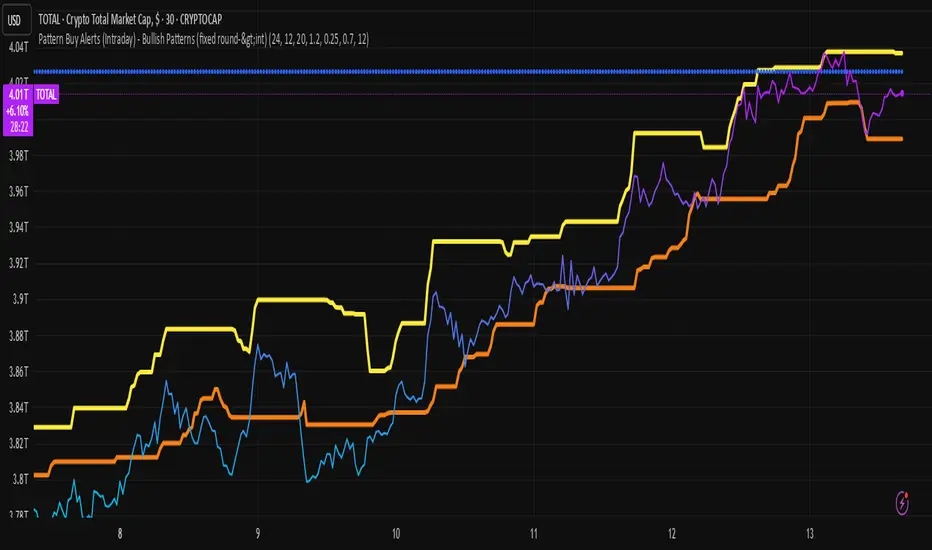
chart pattern prediction
The script plots two things:
predicted_direction → +1 (up) or -1 (down).
predicted_value → the next bar’s estimated close price.
So on your chart you’ll see:
Blue histogram → shows up (+1) or down (-1) prediction.
Orange line → predicted next value.
Interpret the Output
If the blue bar is +1, the model expects the next candle to close higher.
If the blue bar is -1, the model expects the next candle to close lower.
The orange line shows where it thinks the next close will land.
开源脚本
秉承TradingView的精神,该脚本的作者将其开源,以便交易者可以查看和验证其功能。向作者致敬!您可以免费使用该脚本,但请记住,重新发布代码须遵守我们的网站规则。
免责声明
这些信息和出版物并非旨在提供,也不构成TradingView提供或认可的任何形式的财务、投资、交易或其他类型的建议或推荐。请阅读使用条款了解更多信息。
开源脚本
秉承TradingView的精神,该脚本的作者将其开源,以便交易者可以查看和验证其功能。向作者致敬!您可以免费使用该脚本,但请记住,重新发布代码须遵守我们的网站规则。
免责声明
这些信息和出版物并非旨在提供,也不构成TradingView提供或认可的任何形式的财务、投资、交易或其他类型的建议或推荐。请阅读使用条款了解更多信息。