PROTECTED SOURCE SCRIPT
已更新 RVI SD Band Oscillator | BinMasta
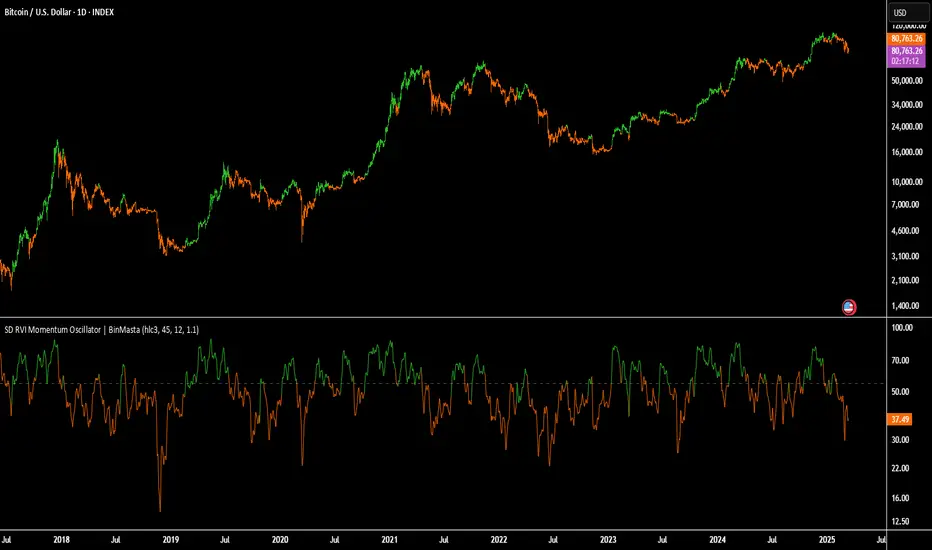
The RVI SD Band Oscillator is a momentum-based indicator that enhances trend analysis using the Relative Vigor Index (RVI) with Standard Deviation (SD) Bands. It refines signals by incorporating a signal line and dynamically adjusting bands based on market volatility.
Core Components:
RVI Calculation: Measures price momentum relative to past movements.
Signal Line: A smoothed version of RVI to identify crossovers.
SD Bands: Standard deviation-based boundaries to gauge overbought/oversold conditions.
Trading Logic:
Trend Direction: Determined by RVI crossover with the signal line.
Momentum Confirmation: Identifies shifts in buying and selling strength.
Trade Signals:
Bullish when the trend is up & the signal is near the lower band.
Bearish when the trend is down & the signal is near the upper band.
Visual Features:
Colored candles highlight potential trend shifts.
Signal line plot provides additional confirmation.
Disclaimer:
This indicator is for educational purposes only and should not be considered financial advice. Past performance is not indicative of future results. Always conduct your own analysis and risk management before making trading decisions. 🚀
版本注释
The RVI SD Band Oscillator is a momentum-based indicator that enhances trend analysis using the Relative Vigor Index (RVI) with Standard Deviation (SD) Bands. It refines signals by incorporating a signal line and dynamically adjusting bands based on market volatility.Core Components:
RVI Calculation: Measures price momentum relative to past movements.
Signal Line: A smoothed version of RVI to identify crossovers.
SD Bands: Standard deviation-based boundaries to gauge overbought/oversold conditions.
Trading Logic:
Trend Direction: Determined by RVI crossover with the signal line.
Momentum Confirmation: Identifies shifts in buying and selling strength.
Trade Signals:
Bullish when the trend is up & the signal is near the lower band.
Bearish when the trend is down & the signal is near the upper band.
Visual Features:
Colored candles highlight potential trend shifts.
Signal line plot provides additional confirmation.
Disclaimer:
This indicator is for educational purposes only and should not be considered financial advice. Past performance is not indicative of future results. Always conduct your own analysis and risk management before making trading decisions. 🚀
受保护脚本
此脚本以闭源形式发布。 但是,您可以自由使用,没有任何限制 — 了解更多信息这里。
免责声明
这些信息和出版物并非旨在提供,也不构成TradingView提供或认可的任何形式的财务、投资、交易或其他类型的建议或推荐。请阅读使用条款了解更多信息。
免责声明
这些信息和出版物并非旨在提供,也不构成TradingView提供或认可的任何形式的财务、投资、交易或其他类型的建议或推荐。请阅读使用条款了解更多信息。