PROTECTED SOURCE SCRIPT
Candle Range Theory - Higher-Timeframe Scanner
The CRT Range Scanner is a sophisticated trading tool that identifies potential Candle Range Theory (CRT) completions across multiple timeframes. Based on the Inner Circle Trader methodology, this indicator helps traders spot key market structure breaks and range expansions.
Key Features:
🔍 Higher-Timeframe Analysis: Automatically detects CRT patterns on higher timeframes while you trade on lower timeframes
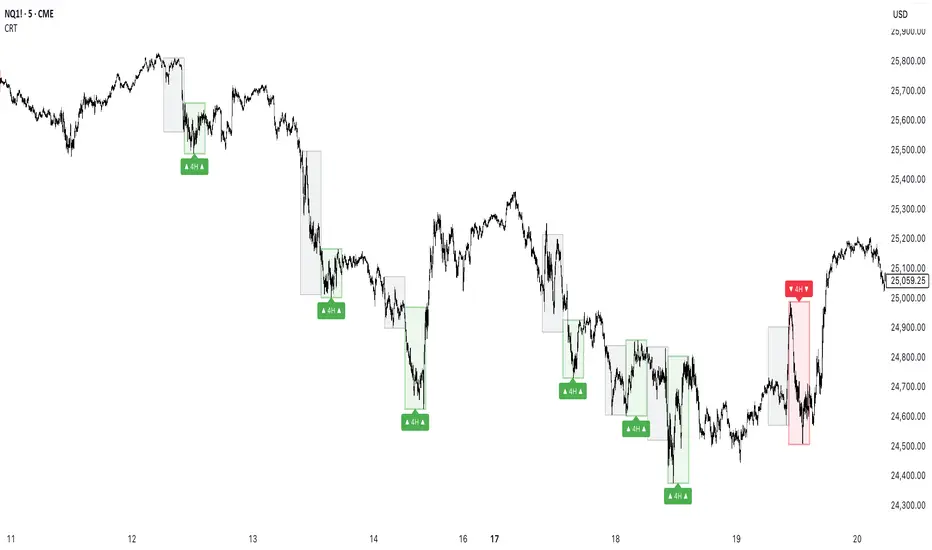
🎯 Bullish & Bearish CRT Signals: Identifies both bullish (range expansion to downside) and bearish (range expansion to upside) completions
⏰ Kill Zone Filtering: Customizable trading sessions to focus only on high-probability market hours
📊 Visual Range Boxes: Clear visual representation of current and previous higher timeframe ranges
🏷️ Smart Labeling: Timeframe-specific labels for easy pattern recognition
How It Works:
Bullish CRT: Occurs when price breaks below previous low during specific session times, indicating potential bullish reversal
Bearish CRT: Occurs when price breaks above previous high during specific session times, indicating potential bearish reversal
The indicator draws colored boxes around the relevant price ranges and provides clear visual cues for pattern recognition
Key Features:
🔍 Higher-Timeframe Analysis: Automatically detects CRT patterns on higher timeframes while you trade on lower timeframes
🎯 Bullish & Bearish CRT Signals: Identifies both bullish (range expansion to downside) and bearish (range expansion to upside) completions
⏰ Kill Zone Filtering: Customizable trading sessions to focus only on high-probability market hours
📊 Visual Range Boxes: Clear visual representation of current and previous higher timeframe ranges
🏷️ Smart Labeling: Timeframe-specific labels for easy pattern recognition
How It Works:
Bullish CRT: Occurs when price breaks below previous low during specific session times, indicating potential bullish reversal
Bearish CRT: Occurs when price breaks above previous high during specific session times, indicating potential bearish reversal
The indicator draws colored boxes around the relevant price ranges and provides clear visual cues for pattern recognition
受保护脚本
此脚本以闭源形式发布。 但是,您可以自由使用,没有任何限制 — 了解更多信息这里。
Luck Is What Happens When Preparation Meets Opportunity
免责声明
这些信息和出版物并非旨在提供,也不构成TradingView提供或认可的任何形式的财务、投资、交易或其他类型的建议或推荐。请阅读使用条款了解更多信息。
受保护脚本
此脚本以闭源形式发布。 但是,您可以自由使用,没有任何限制 — 了解更多信息这里。
Luck Is What Happens When Preparation Meets Opportunity
免责声明
这些信息和出版物并非旨在提供,也不构成TradingView提供或认可的任何形式的财务、投资、交易或其他类型的建议或推荐。请阅读使用条款了解更多信息。