INVITE-ONLY SCRIPT
TM24_SWING_TOOL
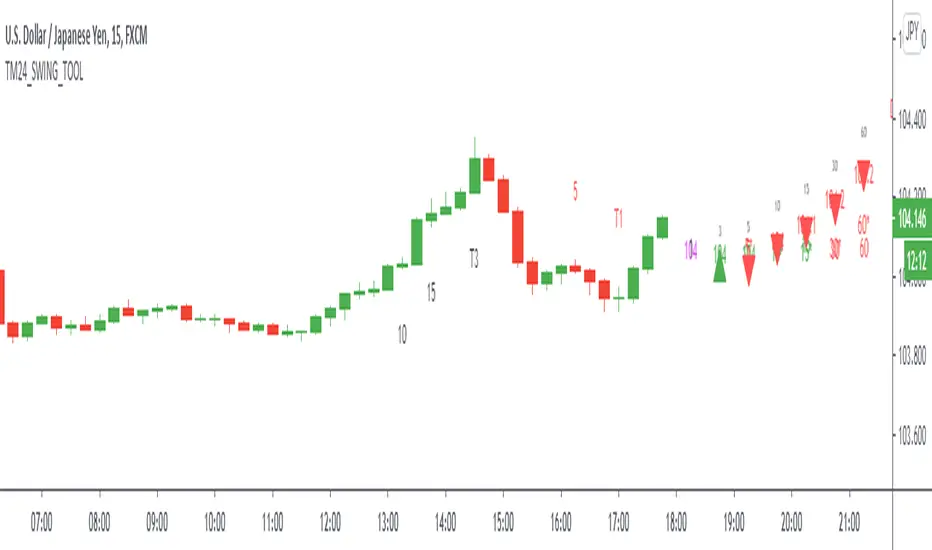
TM24_SWING_TOOL helps to identify following Things for Intraday Position on 15-30-60 Minutes timeframe along with Buy or sell signal.
1. Market Trend (Different Timeframe)
2. Price Direction
3. Area of Support & Resistance
4. Price Momentum
Terminology Use ==> Black from Bottom for - Buy, Red from Top for - Sale Signal, and Numbers are to show time frame indication there is presence of buyer or seller like 1 for buy signal on 1 minute time frame etc.
Display and Interpretation ==> Buy Sale Signal in Digit with 5-10-15-30-60-D for different time frames.
any value signal ending with * shows breakout of support/ resistance and value signal starting with * shows entry to a momentum zone.
Green Mark with Triangle Up shows trend of that timeframe in positive and value shows upside possible direction on that timeframe vice versa for red signal with down triangle
T1 stand for trend change in 1 Minute timeframe and T3 stand for trend change in 3 Minute timeframe
Use market structure, chart pattern, trend lines for more support..
Time frame ==> Use proper Signal with 15 minute, 30 minute time frame
What to Identify ==> Overall Trend for the Swing
How to Use ==>
See how and order buildup is seen and current order position. Also area for volatility and expected movement in price direction
Note: - Use market structure, chart pattern, trend lines and price action parameter for more confirmation.
Entry ==>
Let’s wait the proper area of support or resistance ( Area of Value in case of trend pattern use)
Exit ==>
SL of swing high/low out of market structure with proper risk management and target with proper Risk/ Reward Ratio
Use the Below Contacts to Access this Indicator
仅限邀请脚本
只有作者授权的用户才能访问此脚本。您需要申请并获得使用许可。通常情况下,付款后即可获得许可。更多详情,请按照下方作者的说明操作,或直接联系TradingMind24。
TradingView不建议您付费购买或使用任何脚本,除非您完全信任其作者并了解其工作原理。您也可以在我们的社区脚本找到免费的开源替代方案。
作者的说明
免责声明
这些信息和出版物并非旨在提供,也不构成TradingView提供或认可的任何形式的财务、投资、交易或其他类型的建议或推荐。请阅读使用条款了解更多信息。
仅限邀请脚本
只有作者授权的用户才能访问此脚本。您需要申请并获得使用许可。通常情况下,付款后即可获得许可。更多详情,请按照下方作者的说明操作,或直接联系TradingMind24。
TradingView不建议您付费购买或使用任何脚本,除非您完全信任其作者并了解其工作原理。您也可以在我们的社区脚本找到免费的开源替代方案。
作者的说明
免责声明
这些信息和出版物并非旨在提供,也不构成TradingView提供或认可的任何形式的财务、投资、交易或其他类型的建议或推荐。请阅读使用条款了解更多信息。