INVITE-ONLY SCRIPT
已更新 SRSI Multi TF
As it states this is Satoshi RSI Multi Time Frame
Meaning you can now trade the HTF RSI momentum while on the LTF
so for instance I trade the 5m chart but using the m30 trend using this indicator
the multiple between the two values is 5 so id suggest you keep your multiple the same. So if you want to trade the H1 chart you would set the TREND or "HTF Fast Line" to 300.
Time frames are in integers and run all the way up the "D"
ex
5 min = 5
30 min = 30
60 min = 60
H4 = 240
etc.
you also have
D2, D3
W
M
etc.
best used with EW in mind or some other pattern analysis as this would act as CONFLUENCE to an idea you already entered OR as CONFIRMATION to an idea OR some form of MA such as TrendAID
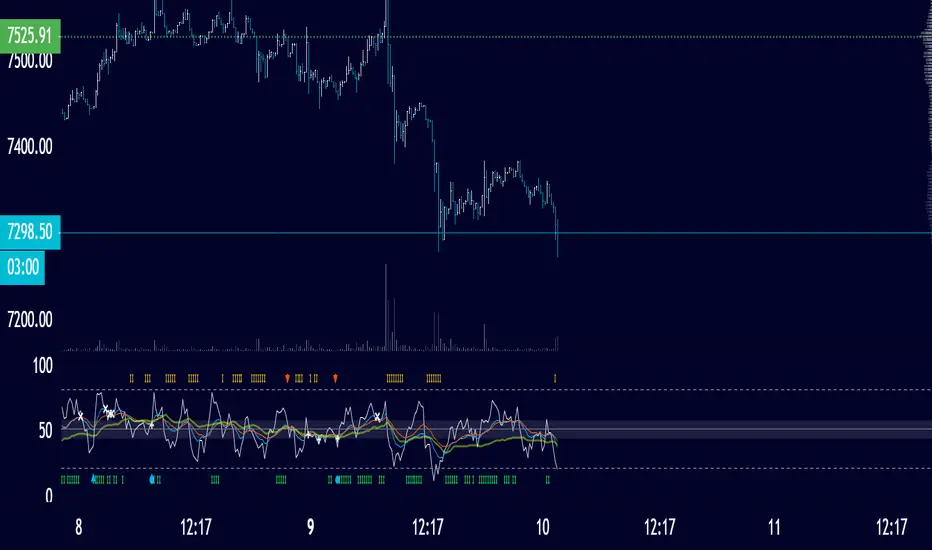
There are signals in regards to momentum , short/long, and a signal i created that uses a series of other criteria to fire.
The strategy is easy for this is as folllowed
SRSI > Fast Line (cyan) and Fast Line > HTF Fast Line(gold) and Med Line(red) > HTF Fast Line == LONG or longs of interest NOTE WHEN THE TREND IS STRONG YOUR HTF slow line will RANGE above or below 50.
VICE versa
You will notice the cyan FAST LINE will LEAD , confirmation of trend reversal is when SRSI breaks above and the above follows.
CHEERS.
Meaning you can now trade the HTF RSI momentum while on the LTF
so for instance I trade the 5m chart but using the m30 trend using this indicator
the multiple between the two values is 5 so id suggest you keep your multiple the same. So if you want to trade the H1 chart you would set the TREND or "HTF Fast Line" to 300.
Time frames are in integers and run all the way up the "D"
ex
5 min = 5
30 min = 30
60 min = 60
H4 = 240
etc.
you also have
D2, D3
W
M
etc.
best used with EW in mind or some other pattern analysis as this would act as CONFLUENCE to an idea you already entered OR as CONFIRMATION to an idea OR some form of MA such as TrendAID
There are signals in regards to momentum , short/long, and a signal i created that uses a series of other criteria to fire.
The strategy is easy for this is as folllowed
SRSI > Fast Line (cyan) and Fast Line > HTF Fast Line(gold) and Med Line(red) > HTF Fast Line == LONG or longs of interest NOTE WHEN THE TREND IS STRONG YOUR HTF slow line will RANGE above or below 50.
VICE versa
You will notice the cyan FAST LINE will LEAD , confirmation of trend reversal is when SRSI breaks above and the above follows.
CHEERS.
版本注释
Better signals and each signal now has its own alert :)removed a few unneeded settings :)
-- next update is take profit signals :) --
仅限邀请脚本
只有作者授权的用户才能访问此脚本。您需要申请并获得使用许可。通常情况下,付款后即可获得许可。更多详情,请按照下方作者的说明操作,或直接联系SatoshiHeavy。
TradingView不建议您付费购买或使用任何脚本,除非您完全信任其作者并了解其工作原理。您也可以在我们的社区脚本找到免费的开源替代方案。
作者的说明
Have a plan. Trade it!
免责声明
这些信息和出版物并非旨在提供,也不构成TradingView提供或认可的任何形式的财务、投资、交易或其他类型的建议或推荐。请阅读使用条款了解更多信息。
仅限邀请脚本
只有作者授权的用户才能访问此脚本。您需要申请并获得使用许可。通常情况下,付款后即可获得许可。更多详情,请按照下方作者的说明操作,或直接联系SatoshiHeavy。
TradingView不建议您付费购买或使用任何脚本,除非您完全信任其作者并了解其工作原理。您也可以在我们的社区脚本找到免费的开源替代方案。
作者的说明
Have a plan. Trade it!
免责声明
这些信息和出版物并非旨在提供,也不构成TradingView提供或认可的任何形式的财务、投资、交易或其他类型的建议或推荐。请阅读使用条款了解更多信息。