OPEN-SOURCE SCRIPT
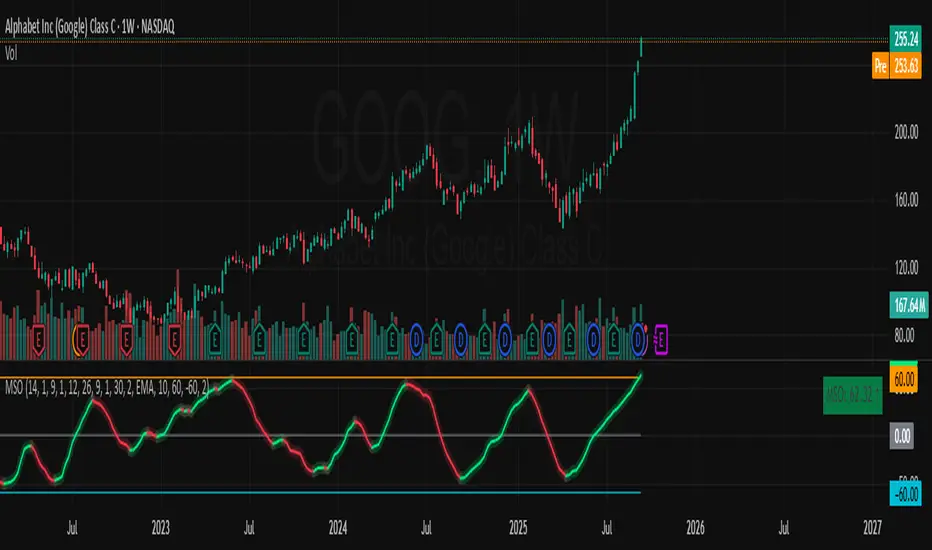
Momentum Shift Oscillator (MSO) [SharpStrat]

Momentum Shift Oscillator (MSO)
The Momentum Shift Oscillator (MSO) is a custom-built oscillator that combines the best parts of RSI, ROC, and MACD into one clean, powerful indicator. Its goal is to identify when momentum shifts are happening in the market, filtering out noise that a single momentum tool might miss.
Why MSO?
Most traders rely on just one momentum indicator like RSI, MACD, or ROC. Each has strengths, but also weaknesses:
By blending all three (with adjustable weights), MSO gives a balanced view of momentum. It captures trend strength, velocity, and exhaustion in one oscillator.
How MSO Works
Inputs:
How to trade with MSO
Why MSO is Unique
The Momentum Shift Oscillator (MSO) is a custom-built oscillator that combines the best parts of RSI, ROC, and MACD into one clean, powerful indicator. Its goal is to identify when momentum shifts are happening in the market, filtering out noise that a single momentum tool might miss.
Why MSO?
Most traders rely on just one momentum indicator like RSI, MACD, or ROC. Each has strengths, but also weaknesses:
- RSI → great for overbought/oversold, but often lags in strong trends.
- ROC (Rate of Change) → captures price velocity, but can be too noisy.
- MACD Histogram → shows trend strength shifts, but reacts slowly at times.
By blending all three (with adjustable weights), MSO gives a balanced view of momentum. It captures trend strength, velocity, and exhaustion in one oscillator.
How MSO Works
Inputs:
- RSI, ROC, and MACD Histogram are calculated with user-defined lengths.
- Each is normalized (so they share the same scale of -100 to +100).
- You can set weights for RSI, ROC, and MACD to emphasize different components.
- The components are blended into a single oscillator value.
- Smoothing (SMA, EMA, or WMA) is applied.
- MSO plots as a smooth line, color-coded by slope (green rising, red falling).
- Overbought and oversold levels are plotted (default: +60 / -60).
- A zero line helps identify bullish vs bearish momentum shifts.
How to trade with MSO
- Zero line crossovers → crossing above zero suggests bullish momentum; crossing below zero suggests bearish momentum.
- Overbought and oversold zones → values above +60 may indicate exhaustion in bullish moves; values below -60 may signal exhaustion in bearish moves.
- Slope of the line → a rising line shows strengthening momentum, while a falling line signals fading momentum.
- Divergences → if price makes new highs or lows but MSO does not, it can point to a possible reversal.
Why MSO is Unique
- Combines trend + momentum + velocity into one view.
- Filters noise better than standalone RSI/MACD.
- Adapts to both trend-following and mean-reversion styles.
- Can be used across any timeframe for confirmation.
开源脚本
秉承TradingView的精神,该脚本的作者将其开源,以便交易者可以查看和验证其功能。向作者致敬!您可以免费使用该脚本,但请记住,重新发布代码须遵守我们的网站规则。
I create free Trading View indicators for the community. Your idea could be next! Submit → forms.gle/aE69zwHrfASScj8T7
免责声明
这些信息和出版物并非旨在提供,也不构成TradingView提供或认可的任何形式的财务、投资、交易或其他类型的建议或推荐。请阅读使用条款了解更多信息。
开源脚本
秉承TradingView的精神,该脚本的作者将其开源,以便交易者可以查看和验证其功能。向作者致敬!您可以免费使用该脚本,但请记住,重新发布代码须遵守我们的网站规则。
I create free Trading View indicators for the community. Your idea could be next! Submit → forms.gle/aE69zwHrfASScj8T7
免责声明
这些信息和出版物并非旨在提供,也不构成TradingView提供或认可的任何形式的财务、投资、交易或其他类型的建议或推荐。请阅读使用条款了解更多信息。