OPEN-SOURCE SCRIPT
Price Scenarios - The Quant Science
GENERAL OVERVIEW
Price Scenarios - The Quant Science is a quantitative statistical indicator that provides a forecast probability about future prices moving using the mathematical-statistical formula of statistical probability and expected value.
https://www.tradingview.com/x/OelfF4iR/
HOW TO USE
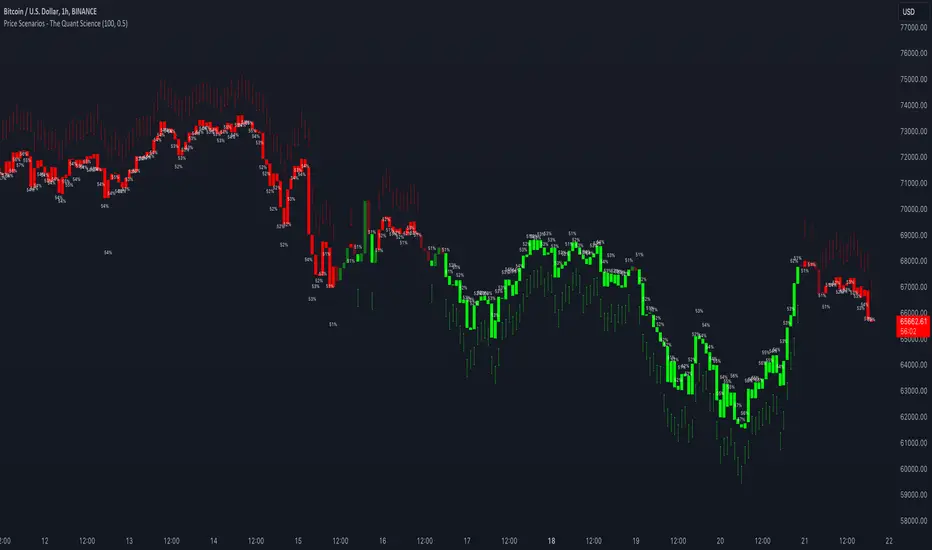
The indicator displays arrow-shaped signals that represent the probable future price movement calculated by the indicator, including the current percentage probability. Additionally, the candlesticks are colored based on the predicted direction to facilitate visual analysis. By default, green is used for bullish movements and red for bearish movements. The trader can set the analysis period (default value is 200) and the percentage threshold of probability to consider (default value is greater than 0.50 or 50%) through the user interface.
https://www.tradingview.com/x/Xw6iQecO/
USER INTERFACE
Lenght analysis: with this features you can handle the length of the dataset to be used for estimating statistical probabilities.
https://www.tradingview.com/x/PBUbP0O3/
Expected value: with this feature you can handle the threshold of the expected value to filter, only probabilities greater than this threshold will be considered by the model. By default, it is set to 0.50, which is equivalent to 50%.
https://www.tradingview.com/x/XjAUkspn/
Design Settings: modify the colors of your indicator with just a few clicks by managing this function.
https://www.tradingview.com/x/WAQySPHn/
We recommend disabling 'Wick' and 'Border' from the settings panel for a smoother and more efficient user experience.
https://www.tradingview.com/x/ZvTAJ1vC/
Price Scenarios - The Quant Science is a quantitative statistical indicator that provides a forecast probability about future prices moving using the mathematical-statistical formula of statistical probability and expected value.
https://www.tradingview.com/x/OelfF4iR/
HOW TO USE
The indicator displays arrow-shaped signals that represent the probable future price movement calculated by the indicator, including the current percentage probability. Additionally, the candlesticks are colored based on the predicted direction to facilitate visual analysis. By default, green is used for bullish movements and red for bearish movements. The trader can set the analysis period (default value is 200) and the percentage threshold of probability to consider (default value is greater than 0.50 or 50%) through the user interface.
https://www.tradingview.com/x/Xw6iQecO/
USER INTERFACE
Lenght analysis: with this features you can handle the length of the dataset to be used for estimating statistical probabilities.
https://www.tradingview.com/x/PBUbP0O3/
Expected value: with this feature you can handle the threshold of the expected value to filter, only probabilities greater than this threshold will be considered by the model. By default, it is set to 0.50, which is equivalent to 50%.
https://www.tradingview.com/x/XjAUkspn/
Design Settings: modify the colors of your indicator with just a few clicks by managing this function.
https://www.tradingview.com/x/WAQySPHn/
We recommend disabling 'Wick' and 'Border' from the settings panel for a smoother and more efficient user experience.
https://www.tradingview.com/x/ZvTAJ1vC/
开源脚本
秉承TradingView的精神,该脚本的作者将其开源,以便交易者可以查看和验证其功能。向作者致敬!您可以免费使用该脚本,但请记住,重新发布代码须遵守我们的网站规则。
免责声明
这些信息和出版物并非旨在提供,也不构成TradingView提供或认可的任何形式的财务、投资、交易或其他类型的建议或推荐。请阅读使用条款了解更多信息。
开源脚本
秉承TradingView的精神,该脚本的作者将其开源,以便交易者可以查看和验证其功能。向作者致敬!您可以免费使用该脚本,但请记住,重新发布代码须遵守我们的网站规则。
免责声明
这些信息和出版物并非旨在提供,也不构成TradingView提供或认可的任何形式的财务、投资、交易或其他类型的建议或推荐。请阅读使用条款了解更多信息。