OPEN-SOURCE SCRIPT
已更新 KRMJ MA
overlays four moving averages on a TradingView chart to help traders identify trend direction, momentum shifts, and dynamic support or resistance levels. It includes a 9-period EMA, 21-period EMA, 20-period SMA, and a 200-period EMA. Each moving average serves a specific role: the 9 EMA responds quickly to price changes and highlights short-term momentum; the 21 EMA smooths out price action slightly more and confirms near-term trends. The 20 SMA provides a simple mid-range trend baseline often used in mean-reversion strategies or range-bound environments. The 200 EMA, a widely recognized long-term trend filter, helps users gauge the dominant market direction.
版本注释
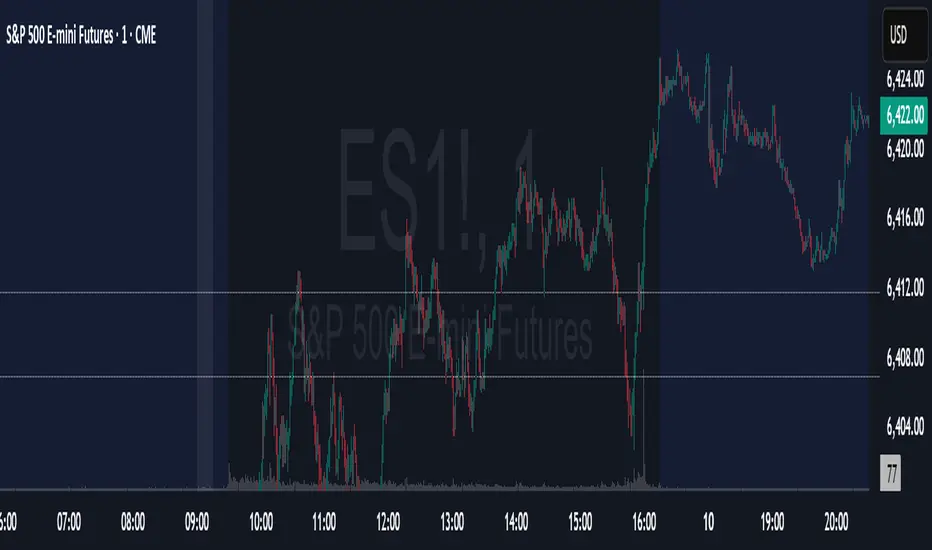
The KRMJ Indicator plots four hidden moving averages (13 EMA, 21 EMA, 20 SMA, 200 EMA) for reference, and automatically draws a light-blue dotted horizontal line each day from the 00:00 open price to 15:59, providing a clear visual reference for the day’s midnight session level.开源脚本
秉承TradingView的精神,该脚本的作者将其开源,以便交易者可以查看和验证其功能。向作者致敬!您可以免费使用该脚本,但请记住,重新发布代码须遵守我们的网站规则。
免责声明
这些信息和出版物并非旨在提供,也不构成TradingView提供或认可的任何形式的财务、投资、交易或其他类型的建议或推荐。请阅读使用条款了解更多信息。
免责声明
这些信息和出版物并非旨在提供,也不构成TradingView提供或认可的任何形式的财务、投资、交易或其他类型的建议或推荐。请阅读使用条款了解更多信息。