OPEN-SOURCE SCRIPT
Trend 1
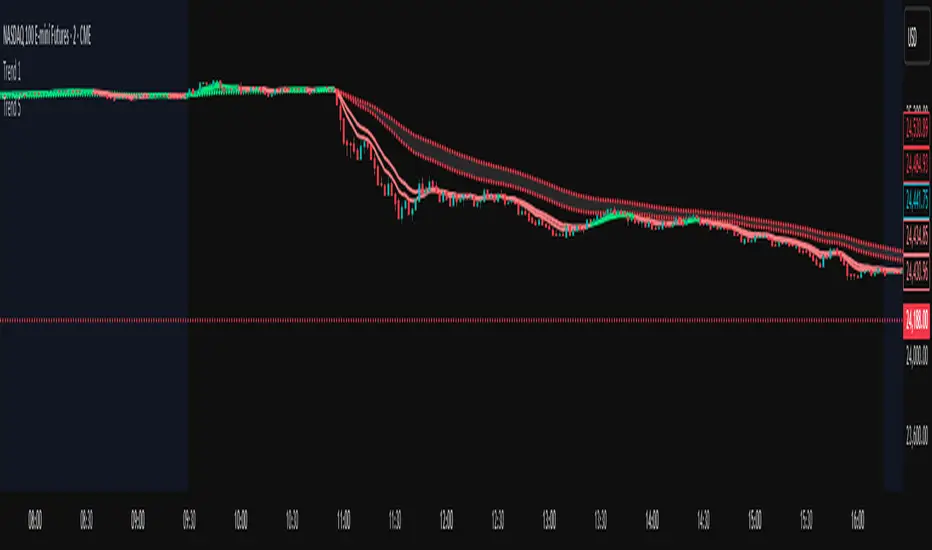
EMA Trend tracker.
This script plots two EMAs: a short-term EMA (line) and a long-term EMA (dots). The line color turns green when the short EMA is above the long EMA, and red when it’s below. Users can select a custom timeframe for the EMA calculation using the input settings. A shaded area is drawn between the two EMAs to visually represent the trend zone.
This script plots two EMAs: a short-term EMA (line) and a long-term EMA (dots). The line color turns green when the short EMA is above the long EMA, and red when it’s below. Users can select a custom timeframe for the EMA calculation using the input settings. A shaded area is drawn between the two EMAs to visually represent the trend zone.
开源脚本
秉承TradingView的精神,该脚本的作者将其开源,以便交易者可以查看和验证其功能。向作者致敬!您可以免费使用该脚本,但请记住,重新发布代码须遵守我们的网站规则。
免责声明
这些信息和出版物并非旨在提供,也不构成TradingView提供或认可的任何形式的财务、投资、交易或其他类型的建议或推荐。请阅读使用条款了解更多信息。
开源脚本
秉承TradingView的精神,该脚本的作者将其开源,以便交易者可以查看和验证其功能。向作者致敬!您可以免费使用该脚本,但请记住,重新发布代码须遵守我们的网站规则。
免责声明
这些信息和出版物并非旨在提供,也不构成TradingView提供或认可的任何形式的财务、投资、交易或其他类型的建议或推荐。请阅读使用条款了解更多信息。