OPEN-SOURCE SCRIPT
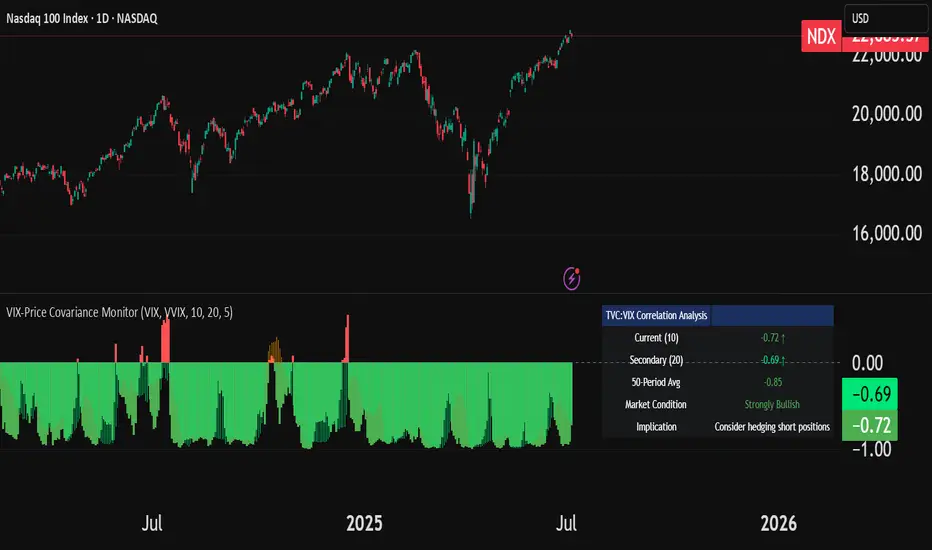
VIX-Price Covariance Monitor

The VIX-Price Covariance Monitor is a statistical tool that measures the evolving relationship between a security's price and volatility indices such as the VIX (or VVIX).
It can give indication of potential market reversal, as typically, volatility and the VIX increase before markets turn red,
This indicator calculates the Pearson correlation coefficient using the formula:
ρ(X,Y) = cov(X,Y) / (σₓ × σᵧ)
Where:
Enjoy!
Features
Interpretation
How to use it
It can give indication of potential market reversal, as typically, volatility and the VIX increase before markets turn red,
This indicator calculates the Pearson correlation coefficient using the formula:
ρ(X,Y) = cov(X,Y) / (σₓ × σᵧ)
Where:
- ρ is the correlation coefficient
- cov(X,Y) is the covariance between price and the volatility index
- σₓ and σᵧ are the standard deviations of price and the volatility index
Enjoy!
Features
- Dual Correlation Periods: Analyze both short-term and long-term correlation trends simultaneously
- Adaptive Color Coding: Correlation strength is visually represented through color intensity
- Market Condition Assessment: Automatic interpretation of correlation values into actionable market insights
- Leading/Lagging Analysis: Optional time-shift analysis to detect predictive relationships
- Detailed Information Panel: Real-time statistics including current correlation values, historical averages, and trading implications
Interpretation
- Positive Correlation (Red): Typically bearish for price, as rising VIX correlates with falling markets. This is what traders should be looking for.
- Negative Correlation (Green): Typically bullish for price, as falling VIX correlates with rising markets
How to use it
- Apply the indicator to any chart to see its correlation with the default VIX index
- Adjust the correlation length to match your trading timeframe (shorter for day trading, longer for swing trading)
- Enable the secondary correlation period to compare different timeframes simultaneously
- For advanced analysis, enable the Leading/Lagging feature to detect if VIX changes precede or follow price movements
- Use the information panel to quickly assess the current market condition and potential trading implications
开源脚本
秉承TradingView的精神,该脚本的作者将其开源,以便交易者可以查看和验证其功能。向作者致敬!您可以免费使用该脚本,但请记住,重新发布代码须遵守我们的网站规则。
免责声明
这些信息和出版物并非旨在提供,也不构成TradingView提供或认可的任何形式的财务、投资、交易或其他类型的建议或推荐。请阅读使用条款了解更多信息。
开源脚本
秉承TradingView的精神,该脚本的作者将其开源,以便交易者可以查看和验证其功能。向作者致敬!您可以免费使用该脚本,但请记住,重新发布代码须遵守我们的网站规则。
免责声明
这些信息和出版物并非旨在提供,也不构成TradingView提供或认可的任何形式的财务、投资、交易或其他类型的建议或推荐。请阅读使用条款了解更多信息。