OPEN-SOURCE SCRIPT
已更新 ATR HEMA [SeerQuant]
What is the ATR Holt Moving Average (HEMA)?
The ATR Holt Moving Average (HEMA) is an advanced smoothing technique that incorporates the Holt exponential smoothing method. Unlike traditional moving averages, HEMA uses two smoothing factors (alpha and gamma) to forecast both the current trend and the trend change rate. This dual-layer approach improves the responsiveness of the moving average to both stable trends and volatile price swings.
When paired with the Average True Range (ATR), the HEMA becomes even more powerful. The ATR acts as a volatility filter, defining a "neutral zone" where minor price fluctuations are ignored. This allows traders to focus on significant market movements while reducing the impact of noise.
⚙️ How the Code Works
The ATR Holt Moving Average (HEMA) combines trend smoothing with volatility filtering to provide traders with dynamic signals. Here's how it functions step by step:
User Inputs and Customization:
Traders can customize the lengths for HEMA's smoothing factors (alphaL and gammaL), the ATR calculation length, and the neutral zone multiplier (atrMult).
The src input allows users to choose the price source for calculations (e.g., hl2), while the col input offers various color themes (Default, Modern, Warm, Cool).
Holt Exponential Moving Average (HEMA) Calculation:
Alpha and Gamma Smoothing Factors:
alpha controls how much weight is given to the current price versus past prices.
gamma smooths the trend change rate, reducing noise. The HEMA formula combines the current price, the previous HEMA value, and a trend adjustment (via the b variable) to create a smooth yet responsive average. The b variable tracks the rate of change in the HEMA over time, further refining the trend detection.
ATR-Based Neutral Zone:
If the change in HEMA (hemaChange) falls within the neutral zone, it is considered insignificant, and the trend color remains unchanged.
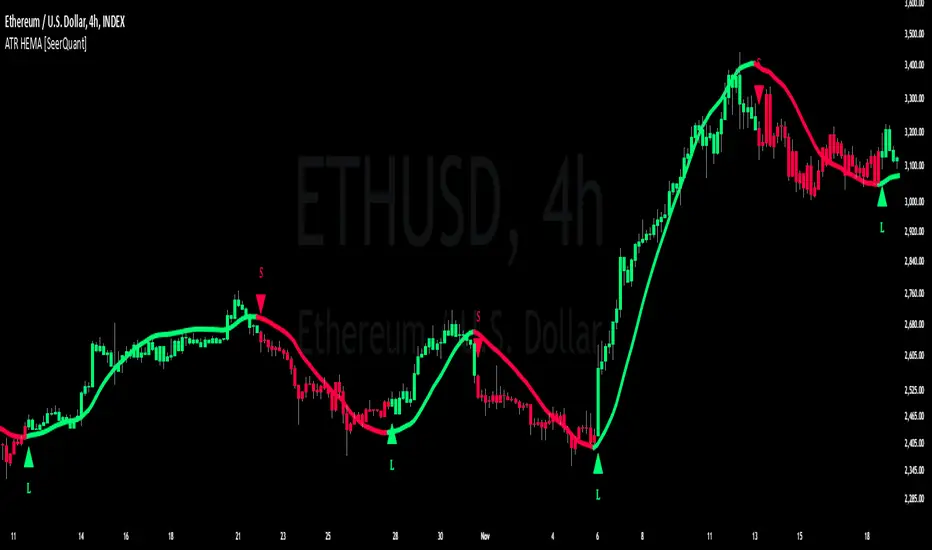
Color and Signal Detection:
Bullish Trend: The color is set to bull when HEMA rises above the neutral zone.
Bearish Trend: The color is set to bear when HEMA falls below the neutral zone.
Neutral Zone: The color remains unchanged, signalling no significant trend.
🚀 Summary
This indicator enhances traditional moving averages by combining the Holt smoothing method with ATR-based volatility filtering. The HEMA adapts to market conditions, detecting trends and transitions while filtering out insignificant price changes. The result is a versatile tool for:
The ATR Holt Moving Average (HEMA) is ideal for traders seeking a balance between responsiveness and stability, offering precise signals in both trending and volatile markets.
📜 Disclaimer
The information provided by this script is for educational and informational purposes only and does not constitute financial, investment, or trading advice. Past performance of any trading system or indicator, including this one, is not indicative of future results. Trading and investing in financial markets involve risk, and it is possible to lose your entire investment.
Users are advised to perform their own due diligence and consult with a licensed financial advisor before making any trading or investment decisions. The creator of this script is not responsible for any trading or investment decisions made based on the use of this script.
This script complies with TradingView's guidelines and is provided as-is, without any guarantee of accuracy, reliability, or performance. Use at your own risk.
The ATR Holt Moving Average (HEMA) is an advanced smoothing technique that incorporates the Holt exponential smoothing method. Unlike traditional moving averages, HEMA uses two smoothing factors (alpha and gamma) to forecast both the current trend and the trend change rate. This dual-layer approach improves the responsiveness of the moving average to both stable trends and volatile price swings.
When paired with the Average True Range (ATR), the HEMA becomes even more powerful. The ATR acts as a volatility filter, defining a "neutral zone" where minor price fluctuations are ignored. This allows traders to focus on significant market movements while reducing the impact of noise.
⚙️ How the Code Works
The ATR Holt Moving Average (HEMA) combines trend smoothing with volatility filtering to provide traders with dynamic signals. Here's how it functions step by step:
User Inputs and Customization:
Traders can customize the lengths for HEMA's smoothing factors (alphaL and gammaL), the ATR calculation length, and the neutral zone multiplier (atrMult).
The src input allows users to choose the price source for calculations (e.g., hl2), while the col input offers various color themes (Default, Modern, Warm, Cool).
Holt Exponential Moving Average (HEMA) Calculation:
Alpha and Gamma Smoothing Factors:
alpha controls how much weight is given to the current price versus past prices.
gamma smooths the trend change rate, reducing noise. The HEMA formula combines the current price, the previous HEMA value, and a trend adjustment (via the b variable) to create a smooth yet responsive average. The b variable tracks the rate of change in the HEMA over time, further refining the trend detection.
ATR-Based Neutral Zone:
If the change in HEMA (hemaChange) falls within the neutral zone, it is considered insignificant, and the trend color remains unchanged.
Color and Signal Detection:
Bullish Trend: The color is set to bull when HEMA rises above the neutral zone.
Bearish Trend: The color is set to bear when HEMA falls below the neutral zone.
Neutral Zone: The color remains unchanged, signalling no significant trend.
🚀 Summary
This indicator enhances traditional moving averages by combining the Holt smoothing method with ATR-based volatility filtering. The HEMA adapts to market conditions, detecting trends and transitions while filtering out insignificant price changes. The result is a versatile tool for:
The ATR Holt Moving Average (HEMA) is ideal for traders seeking a balance between responsiveness and stability, offering precise signals in both trending and volatile markets.
📜 Disclaimer
The information provided by this script is for educational and informational purposes only and does not constitute financial, investment, or trading advice. Past performance of any trading system or indicator, including this one, is not indicative of future results. Trading and investing in financial markets involve risk, and it is possible to lose your entire investment.
Users are advised to perform their own due diligence and consult with a licensed financial advisor before making any trading or investment decisions. The creator of this script is not responsible for any trading or investment decisions made based on the use of this script.
This script complies with TradingView's guidelines and is provided as-is, without any guarantee of accuracy, reliability, or performance. Use at your own risk.
版本注释
Shows symbol and timeframe on the chart.版本注释
~ Updated the code structure~ Removed the histogram and improved the plotting
~ Can toggle bar colouring on/off
版本注释
Added alert functions.开源脚本
秉承TradingView的精神,该脚本的作者将其开源,以便交易者可以查看和验证其功能。向作者致敬!您可以免费使用该脚本,但请记住,重新发布代码须遵守我们的网站规则。
Follow along on X for daily market updates!
免责声明
这些信息和出版物并非旨在提供,也不构成TradingView提供或认可的任何形式的财务、投资、交易或其他类型的建议或推荐。请阅读使用条款了解更多信息。
开源脚本
秉承TradingView的精神,该脚本的作者将其开源,以便交易者可以查看和验证其功能。向作者致敬!您可以免费使用该脚本,但请记住,重新发布代码须遵守我们的网站规则。
Follow along on X for daily market updates!
免责声明
这些信息和出版物并非旨在提供,也不构成TradingView提供或认可的任何形式的财务、投资、交易或其他类型的建议或推荐。请阅读使用条款了解更多信息。