OPEN-SOURCE SCRIPT
Volume Weighted Average Price Z-Score [tordne]
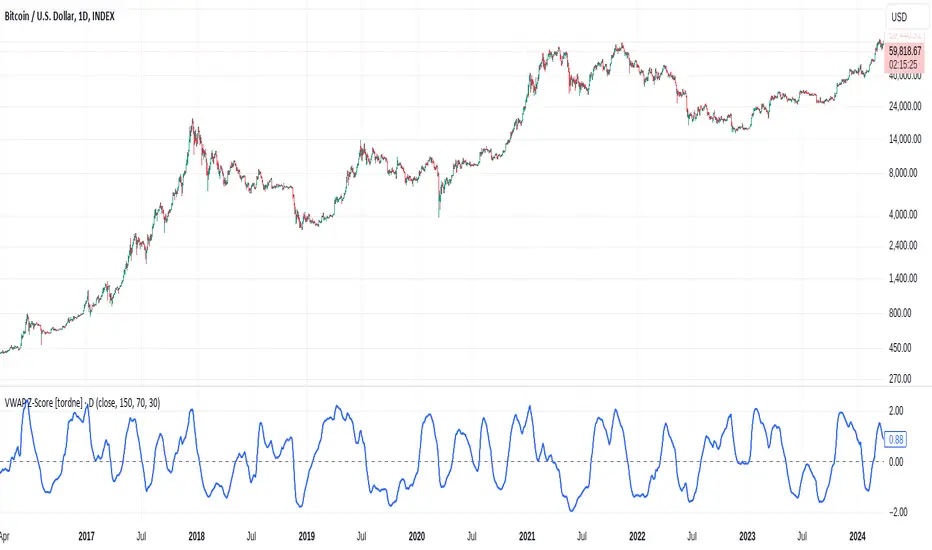
The VWAP Z-Score indicator calculates the Z-score of the Volume Weighted Average Price (VWAP) Ratio, allowing traders to analyze how the current price compares to the VWAP over a specified period. This can provide insights into the relative price strength, overbought/oversold conditions, and price deviations from its average.
Key Components:
VWAP Calculation:
VWAP (Volume Weighted Average Price) is the ratio of the cumulative traded value (price multiplied by volume) to the cumulative volume over a specified period (VWAP Calculation Length).
The VWAP Ratio is then computed by dividing the current price (or selected source) by the calculated VWAP.
Z-Score Calculation:
The Z-score is a statistical measure that shows how far the current VWAP Ratio deviates from its mean, in terms of standard deviations.
The Z-score is calculated by comparing the VWAP Ratio to its moving average (Z-Score Length) and dividing the difference by the standard deviation of the VWAP Ratio over the same period.
This helps in identifying whether the current price is unusually high or low relative to its VWAP.
Smoothing:
The Z-score is further smoothed using an Exponential Moving Average (EMA) to reduce noise and enhance readability. The smoothing length is adjustable via the input settings (Smoothing Length), with a default value of 14 periods.
Input Parameters:
Source: The price source used for calculation (default is the closing price).
VWAP Calculation Length: Defines the period over which the VWAP is calculated (default is 150).
Z-Score Length: The lookback period for calculating the Z-score (default is 70).
Smoothing Length (EMA): The number of periods over which to smooth the Z-score using an EMA (default is 30).
Interpretation:
Z-Score:
A Z-score close to 0 indicates that the price is close to its VWAP.
A positive Z-score suggests that the price is higher than its VWAP, potentially indicating overbought conditions.
A negative Z-score suggests that the price is lower than its VWAP, potentially indicating oversold conditions.
This indicator provides a dynamic and statistical way of assessing price movements relative to VWAP, aiding in mean reversion strategies, trend following, or momentum analysis.
开源脚本
秉承TradingView的精神,该脚本的作者将其开源,以便交易者可以查看和验证其功能。向作者致敬!您可以免费使用该脚本,但请记住,重新发布代码须遵守我们的网站规则。
免责声明
这些信息和出版物并非旨在提供,也不构成TradingView提供或认可的任何形式的财务、投资、交易或其他类型的建议或推荐。请阅读使用条款了解更多信息。
免责声明
这些信息和出版物并非旨在提供,也不构成TradingView提供或认可的任何形式的财务、投资、交易或其他类型的建议或推荐。请阅读使用条款了解更多信息。