PROTECTED SOURCE SCRIPT
已更新 MTF RSI Bounce+ [Intromoto]
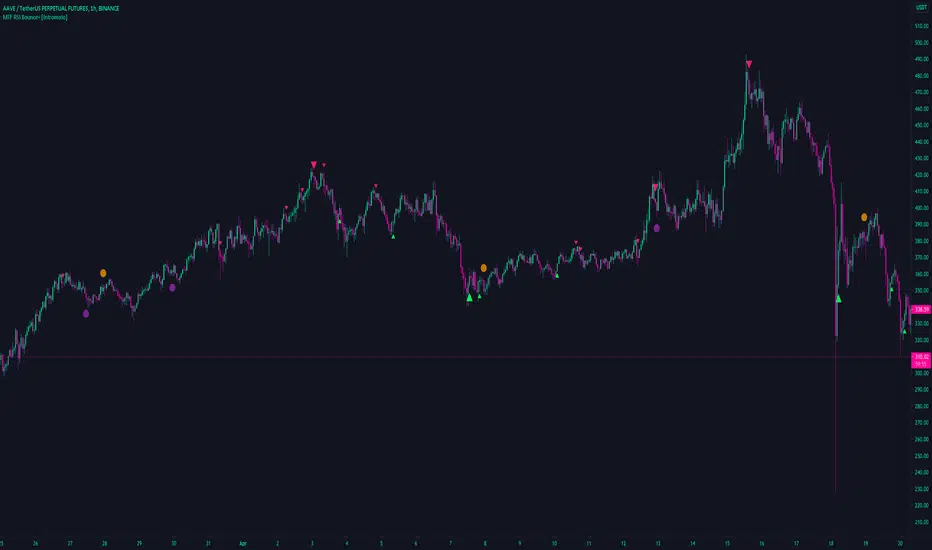
This script focuses on the relative strength index of an asset and plots shapes/lines based of "bounce" and crosses of the 50 midline
Barcoloring is based on the lower time frame over/under 50 for directional bias.
Smaller plotshapes are printed when the rsi "bounces" on the lower time frame 50, i.e is higher at first, lower on second, and back above the 50 on the 3rd close of the sequence.
Larger plotshapes occur on higher time frame, "D" by default, RSI crossovers. A line, user input styling available, is plotted horizontally for reference.
Alerts added for the HTF crossover/under
Thanks
版本注释
Clarified inputs, removed HTF bounce. Styles changed版本注释
Changed default HTF resolution to 12H版本注释
Style settings and metrics changes. Added two more bounce sets, which abide by the same period length and chart resolution. Removed HTF bounce resolution. 受保护脚本
此脚本以闭源形式发布。 但是,您可以自由使用,没有任何限制 — 了解更多信息这里。
DM for access.
Follow on Twitter for updates.
One time fee, no subscription
twitter.com/IntroMoto
Follow on Twitter for updates.
One time fee, no subscription
twitter.com/IntroMoto
免责声明
这些信息和出版物并非旨在提供,也不构成TradingView提供或认可的任何形式的财务、投资、交易或其他类型的建议或推荐。请阅读使用条款了解更多信息。
受保护脚本
此脚本以闭源形式发布。 但是,您可以自由使用,没有任何限制 — 了解更多信息这里。
DM for access.
Follow on Twitter for updates.
One time fee, no subscription
twitter.com/IntroMoto
Follow on Twitter for updates.
One time fee, no subscription
twitter.com/IntroMoto
免责声明
这些信息和出版物并非旨在提供,也不构成TradingView提供或认可的任何形式的财务、投资、交易或其他类型的建议或推荐。请阅读使用条款了解更多信息。