OPEN-SOURCE SCRIPT
已更新 Major Minor Fib Points
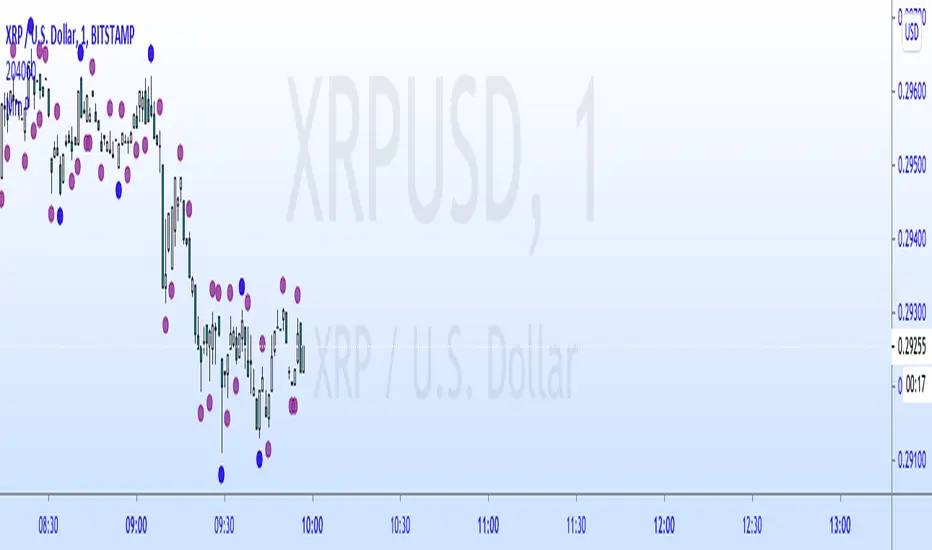
Hey guys I made this indicator that plots major and minor lows based on the candle duration since it's last seen a lower low or higher high.
I made this after watching a seminar and seeing it as a way to simply, easily and naturally find the plot points for fibonacci retracements and extentions.
Blue dots are Major, Purple are Minor.
The dots only appear if there has not been a newly established low or high in the default(13) periods (for Major) before or after that candle. This is done to make the pivot candle clear and less subjective. The periods are also changeable in the format icon.
Let me know what if you like/hate it. It's just another indicator and is only a visual tool. But I hope it helps. I hope it helps me as well!
版本注释
Update: made shapes auto size now版本注释
Added alerts on request开源脚本
秉承TradingView的精神,该脚本的作者将其开源,以便交易者可以查看和验证其功能。向作者致敬!您可以免费使用该脚本,但请记住,重新发布代码须遵守我们的网站规则。
免责声明
这些信息和出版物并非旨在提供,也不构成TradingView提供或认可的任何形式的财务、投资、交易或其他类型的建议或推荐。请阅读使用条款了解更多信息。
免责声明
这些信息和出版物并非旨在提供,也不构成TradingView提供或认可的任何形式的财务、投资、交易或其他类型的建议或推荐。请阅读使用条款了解更多信息。