OPEN-SOURCE SCRIPT
已更新 Elliott Wave Oscillator with Peak Detection
The Elliott Wave Oscillator with Derivative Peak Detection and Breakout Bands is a technical indicator that blends traditional Elliott Wave theory with modern derivative-based peak detection and breakout bands for a clearer view of market trends.
Key Components:
Elliott Wave Oscillator (EWO):
The core of the indicator is based on the difference between two simple moving averages (SMA): a short-term SMA (default length: 5) and a long-term SMA (default length: 35).
This difference is expressed either as an absolute value or a percentage of the current price, depending on the user’s input.
Smoothing:
The EWO is smoothed using an Exponential Moving Average (EMA) to filter out noise and provide a clearer trend direction.
The smoothing length is adaptive based on the current chart's timeframe (e.g., longer smoothing for daily charts).
Derivative Peak Detection:
The smoothed EWO is analyzed for peaks (positive) and troughs (negative) by calculating the derivative (rate of change) between consecutive values.
Peaks are detected when the derivative transitions from positive to negative, while troughs are identified when the derivative switches from negative to positive.
Tolerance levels are adjustable and vary by timeframe to avoid false signals.
Breakout Bands:
Upper and lower breakout bands are dynamically generated based on the smoothed EWO.
The bands help to filter significant peaks and troughs, only highlighting those that occur beyond the breakout levels.
Users can choose to display these bands and use them to filter out less significant peaks and troughs.
Visualization:
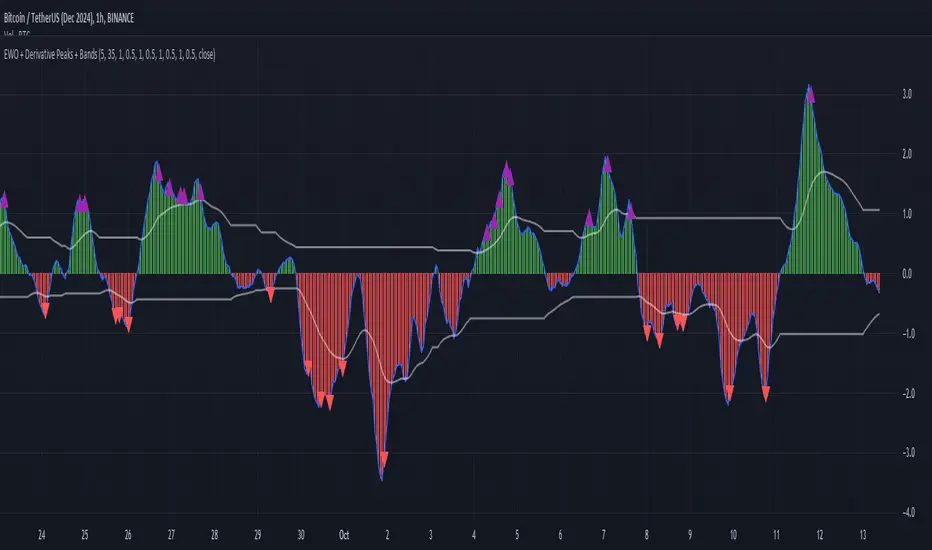
The original, unsmoothed EWO is plotted as a histogram, with positive values in green and negative values in red.
The smoothed EWO is plotted as a blue line, providing a clearer view of the underlying trend.
The breakout bands, if enabled, are plotted as white lines to visualize the upper and lower bounds of the oscillator's movement.
Positive peaks and negative troughs that meet the filtering criteria are marked with purple triangles (for peaks) and red triangles (for troughs) on the chart.
Customization Options:
Timeframe-based Smoothing and Tolerance: Different smoothing lengths and tolerance levels can be set for daily, hourly, and 5-minute charts.
Breakout Bands: Users can toggle the display of breakout bands and adjust their visual properties.
Peak Filtering: Peaks and troughs can be filtered based on whether they break out beyond the bands, or all peaks can be shown.
This indicator provides a unique blend of trend detection through the Elliott Wave Oscillator and derivative analysis to highlight significant market reversals while offering breakout bands as a filtering mechanism for false signals.
Key Components:
Elliott Wave Oscillator (EWO):
The core of the indicator is based on the difference between two simple moving averages (SMA): a short-term SMA (default length: 5) and a long-term SMA (default length: 35).
This difference is expressed either as an absolute value or a percentage of the current price, depending on the user’s input.
Smoothing:
The EWO is smoothed using an Exponential Moving Average (EMA) to filter out noise and provide a clearer trend direction.
The smoothing length is adaptive based on the current chart's timeframe (e.g., longer smoothing for daily charts).
Derivative Peak Detection:
The smoothed EWO is analyzed for peaks (positive) and troughs (negative) by calculating the derivative (rate of change) between consecutive values.
Peaks are detected when the derivative transitions from positive to negative, while troughs are identified when the derivative switches from negative to positive.
Tolerance levels are adjustable and vary by timeframe to avoid false signals.
Breakout Bands:
Upper and lower breakout bands are dynamically generated based on the smoothed EWO.
The bands help to filter significant peaks and troughs, only highlighting those that occur beyond the breakout levels.
Users can choose to display these bands and use them to filter out less significant peaks and troughs.
Visualization:
The original, unsmoothed EWO is plotted as a histogram, with positive values in green and negative values in red.
The smoothed EWO is plotted as a blue line, providing a clearer view of the underlying trend.
The breakout bands, if enabled, are plotted as white lines to visualize the upper and lower bounds of the oscillator's movement.
Positive peaks and negative troughs that meet the filtering criteria are marked with purple triangles (for peaks) and red triangles (for troughs) on the chart.
Customization Options:
Timeframe-based Smoothing and Tolerance: Different smoothing lengths and tolerance levels can be set for daily, hourly, and 5-minute charts.
Breakout Bands: Users can toggle the display of breakout bands and adjust their visual properties.
Peak Filtering: Peaks and troughs can be filtered based on whether they break out beyond the bands, or all peaks can be shown.
This indicator provides a unique blend of trend detection through the Elliott Wave Oscillator and derivative analysis to highlight significant market reversals while offering breakout bands as a filtering mechanism for false signals.
版本注释
The Elliott Wave Oscillator with Derivative Peak Detection and Breakout Bands is a technical indicator that blends traditional Elliott Wave theory with modern derivative-based peak detection and breakout bands for a clearer view of market trends.Key Components:
Elliott Wave Oscillator (EWO):
The core of the indicator is based on the difference between two simple moving averages (SMA): a short-term SMA (default length: 5) and a long-term SMA (default length: 35).
This difference is expressed either as an absolute value or a percentage of the current price, depending on the user’s input.
Smoothing:
The EWO is smoothed using an Exponential Moving Average (EMA) to filter out noise and provide a clearer trend direction.
The smoothing length is adaptive based on the current chart's timeframe (e.g., longer smoothing for daily charts).
Derivative Peak Detection:
The smoothed EWO is analyzed for peaks (positive) and troughs (negative) by calculating the derivative (rate of change) between consecutive values.
Peaks are detected when the derivative transitions from positive to negative, while troughs are identified when the derivative switches from negative to positive.
Tolerance levels are adjustable and vary by timeframe to avoid false signals.
Breakout Bands:
Upper and lower breakout bands are dynamically generated based on the smoothed EWO.
The bands help to filter significant peaks and troughs, only highlighting those that occur beyond the breakout levels.
Users can choose to display these bands and use them to filter out less significant peaks and troughs.
Visualization:
The original, unsmoothed EWO is plotted as a histogram, with positive values in green and negative values in red.
The smoothed EWO is plotted as a blue line, providing a clearer view of the underlying trend.
The breakout bands, if enabled, are plotted as white lines to visualize the upper and lower bounds of the oscillator's movement.
Positive peaks and negative troughs that meet the filtering criteria are marked with purple triangles (for peaks) and red triangles (for troughs) on the chart.
Customization Options:
Timeframe-based Smoothing and Tolerance: Different smoothing lengths and tolerance levels can be set for daily, hourly, and 5-minute charts.
Breakout Bands: Users can toggle the display of breakout bands and adjust their visual properties.
Peak Filtering: Peaks and troughs can be filtered based on whether they break out beyond the bands, or all peaks can be shown.
This indicator provides a unique blend of trend detection through the Elliott Wave Oscillator and derivative analysis to highlight significant market reversals while offering breakout bands as a filtering mechanism for false signals.
开源脚本
秉承TradingView的精神,该脚本的作者将其开源,以便交易者可以查看和验证其功能。向作者致敬!您可以免费使用该脚本,但请记住,重新发布代码须遵守我们的网站规则。
免责声明
这些信息和出版物并非旨在提供,也不构成TradingView提供或认可的任何形式的财务、投资、交易或其他类型的建议或推荐。请阅读使用条款了解更多信息。
免责声明
这些信息和出版物并非旨在提供,也不构成TradingView提供或认可的任何形式的财务、投资、交易或其他类型的建议或推荐。请阅读使用条款了解更多信息。