PROTECTED SOURCE SCRIPT
TT Historical Ranges
Beta - Ongoing Updates
Used to overlay the Open and Close prices and trading range for Last Daily, Weekly and Monthly Candle on your own charts and timeframes.
In the example shown
Indicator Settings - Daily, Weekly, Monthly and User Selected plots have their own display and style options.
NOTE: used for my own educational purposes and is not fit for trading advice or strategies.
Used to overlay the Open and Close prices and trading range for Last Daily, Weekly and Monthly Candle on your own charts and timeframes.
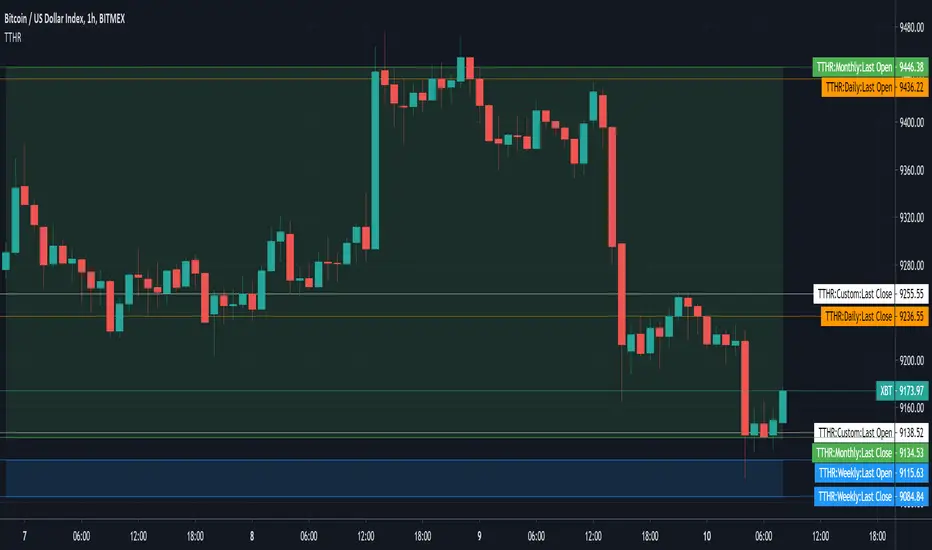
In the example shown
- the green area is showing the last Monthly Candle open and close range [price lines : on | historical fill range : on]
- the blue area at the bottom is showing the last Weekly Candle open and close range [price lines : on | historical fill range : on]
- the remaining horizontal are for the last Daily Candle (orange lines) and the User Selected Candle of 3 Days (white lines). [price lines : on | historical fill range : off]
- NOTE: the labels next to the scale for each price line are only visible if you turn on indicator labels in the scale settings.
Indicator Settings - Daily, Weekly, Monthly and User Selected plots have their own display and style options.
- enable or disable last open price line
- enable or disable last close price line
- enable or disable historical trading range (fill between open/close)
- select and your own preferred time frame to display
NOTE: used for my own educational purposes and is not fit for trading advice or strategies.
受保护脚本
此脚本以闭源形式发布。 但是,您可以自由使用,没有任何限制 — 了解更多信息这里。
免责声明
这些信息和出版物并非旨在提供,也不构成TradingView提供或认可的任何形式的财务、投资、交易或其他类型的建议或推荐。请阅读使用条款了解更多信息。
免责声明
这些信息和出版物并非旨在提供,也不构成TradingView提供或认可的任何形式的财务、投资、交易或其他类型的建议或推荐。请阅读使用条款了解更多信息。