OPEN-SOURCE SCRIPT
Stochastic Structure Analyzer
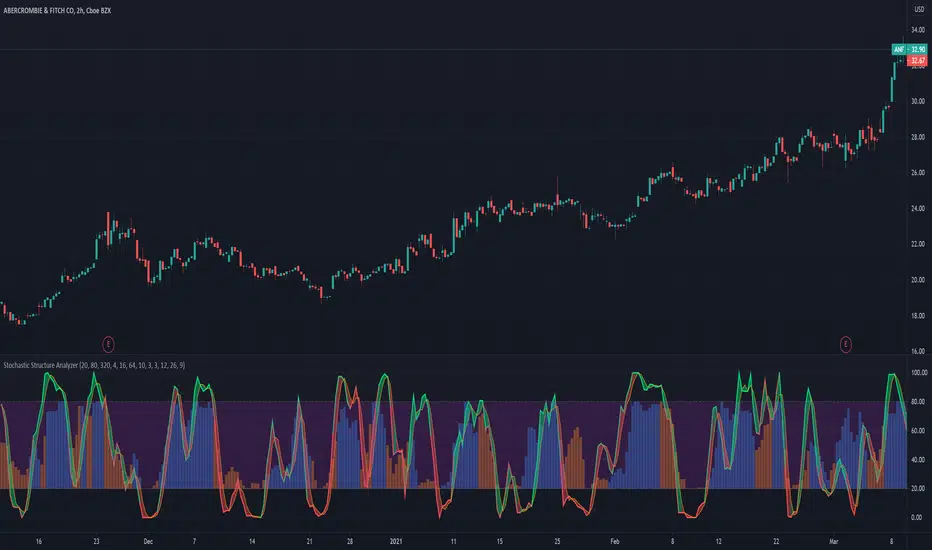
A momentum indicator that uses the highest and lowest values for price in three different lookback lengths to find the performance relative to three timeframes.
- Stochastic can be used for buy and sell signals as usual.
- The bars at the back represent the stochastic value of the OBV based structure calculation.
- The color of the stochastic line is a preliminary indicator of an up move.
- The fill color between the stochastic lines indicate the trend strength,
How to use: I suggest combining this with a higher timeframe to buy when the both stochastics are crossing below 20 line. And sell when one of the stochastics crosses-down.
This is the stochastic version of the structure analyzer(tradingview.com/script/66qgS9gj-Structure-Analyzer/).
开源脚本
秉承TradingView的精神,该脚本的作者将其开源,以便交易者可以查看和验证其功能。向作者致敬!您可以免费使用该脚本,但请记住,重新发布代码须遵守我们的网站规则。
免责声明
这些信息和出版物并非旨在提供,也不构成TradingView提供或认可的任何形式的财务、投资、交易或其他类型的建议或推荐。请阅读使用条款了解更多信息。
免责声明
这些信息和出版物并非旨在提供,也不构成TradingView提供或认可的任何形式的财务、投资、交易或其他类型的建议或推荐。请阅读使用条款了解更多信息。