OPEN-SOURCE SCRIPT
Bollinger Bands %B Compare Vix
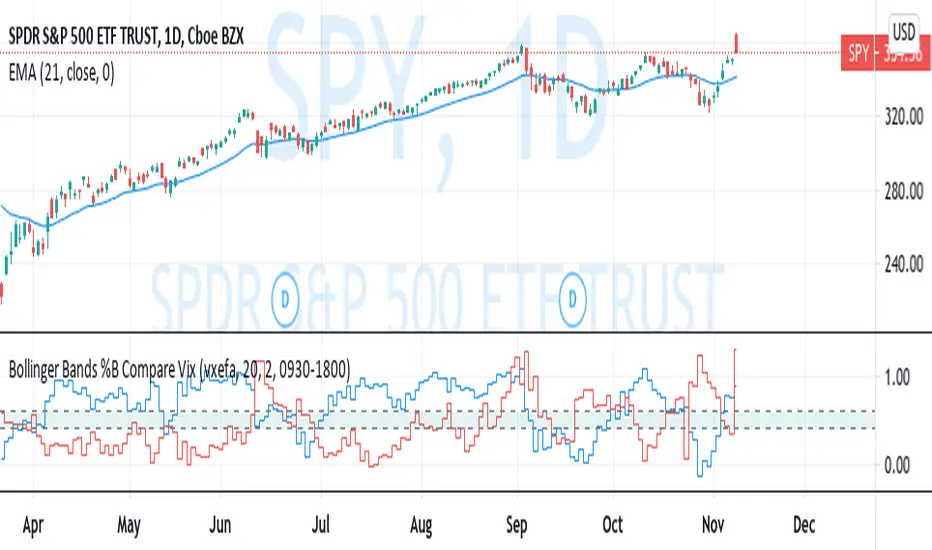
This imple script converts your chosen chart price and outputs it as a percentage in relation to the Vix percentage.
If price (Blue line) is higher than 0.60 and vix (Red Line) is lower than 0. 40 then there is lower volatility and this is good for buying.
If price (Blue line) is lower than 0. 40 and vix (Red Line) is higher than 0.60 then there is higher volatility and this is good for selling, exiting and cash only.
If you like risk you can enter as soon as the price and vix cross in either direction
This is my first script, please give me a lot of critique, I won't cry hahaha :)
For greater accuracy, you use these Vix products for their specific stocks/Indicies:
Apple - VVXAPL
Google - VVXGOG
Amazon - VVXAZN
IBM - VVXIBM
Goldman Sachs - VVXGS
NASDAQ 100 = VXN
VXN
SP100 - $CBOE:VXO
SP500 (3months) - VIX3M
VIX3M
XLE(energy sector) - $CBOE:VXXLE
EWZ(brazil etf) - VVXEWZ
EEM( emerging markets etf) -VVXEEM
EFA (MSCI ETF) - VVXEFA
FXI (Cina ETF) - VVXFXI
If price (Blue line) is higher than 0.60 and vix (Red Line) is lower than 0. 40 then there is lower volatility and this is good for buying.
If price (Blue line) is lower than 0. 40 and vix (Red Line) is higher than 0.60 then there is higher volatility and this is good for selling, exiting and cash only.
If you like risk you can enter as soon as the price and vix cross in either direction
This is my first script, please give me a lot of critique, I won't cry hahaha :)
For greater accuracy, you use these Vix products for their specific stocks/Indicies:
Apple - VVXAPL
Google - VVXGOG
Amazon - VVXAZN
IBM - VVXIBM
Goldman Sachs - VVXGS
NASDAQ 100 =
SP100 - $CBOE:VXO
SP500 (3months) -
XLE(energy sector) - $CBOE:VXXLE
EWZ(brazil etf) - VVXEWZ
EEM( emerging markets etf) -VVXEEM
EFA (MSCI ETF) - VVXEFA
FXI (Cina ETF) - VVXFXI
开源脚本
秉承TradingView的精神,该脚本的作者将其开源,以便交易者可以查看和验证其功能。向作者致敬!您可以免费使用该脚本,但请记住,重新发布代码须遵守我们的网站规则。
免责声明
这些信息和出版物并非旨在提供,也不构成TradingView提供或认可的任何形式的财务、投资、交易或其他类型的建议或推荐。请阅读使用条款了解更多信息。
开源脚本
秉承TradingView的精神,该脚本的作者将其开源,以便交易者可以查看和验证其功能。向作者致敬!您可以免费使用该脚本,但请记住,重新发布代码须遵守我们的网站规则。
免责声明
这些信息和出版物并非旨在提供,也不构成TradingView提供或认可的任何形式的财务、投资、交易或其他类型的建议或推荐。请阅读使用条款了解更多信息。