PROTECTED SOURCE SCRIPT
[VBose] Bank Nifty Volume With Accumulation/Distribution
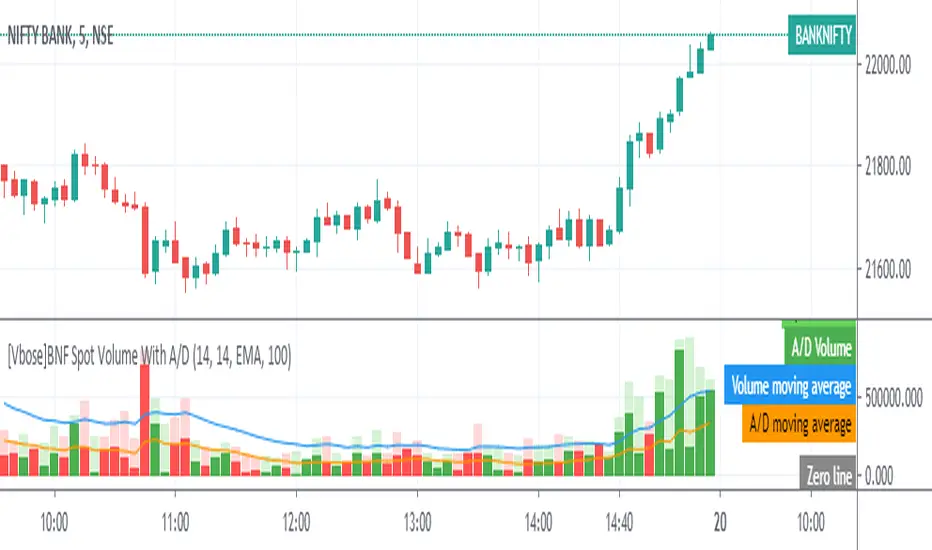
Bank Nifty Volume With Accumulation/Distribution Indicator shows Weighted Spot volume bars and the accumulated/distributed (A/D) portion of them. It calculates candle body to candle height ratio and multiplies it by Spot volume: Spot volume*(close-open)/(high-low)
The Spot Volume is calculated by the weighted sum (Composite method) of deriving stock volume from underlying 12 stocks in the Bank Nifty Index.
This Indicator has ability to multiply The Volume With Price and Take the Output of Volume or A/D to be fed as source in other indicators.
Light Green Color Shows Total Bull Volume [close]>[previous close] With Dark Green Color as Accumulation
Light Red Color Shows Total Bear Volume[close]<[previous close] With Dark Red Color as Distribution
Moving Average for Volume and A/D Line can be added with custom Moving Average Settings
Note:Trading view still does not provide Volume in Bank Nifty Index and this indicator calculates Spot Volume which is different than Futures Volume of Bank Nifty.
受保护脚本
此脚本以闭源形式发布。 但是,您可以自由使用,没有任何限制 — 了解更多信息这里。
免责声明
这些信息和出版物并非旨在提供,也不构成TradingView提供或认可的任何形式的财务、投资、交易或其他类型的建议或推荐。请阅读使用条款了解更多信息。
受保护脚本
此脚本以闭源形式发布。 但是,您可以自由使用,没有任何限制 — 了解更多信息这里。
免责声明
这些信息和出版物并非旨在提供,也不构成TradingView提供或认可的任何形式的财务、投资、交易或其他类型的建议或推荐。请阅读使用条款了解更多信息。