OPEN-SOURCE SCRIPT
Perfect Trend EMAs (9-21-50-100)
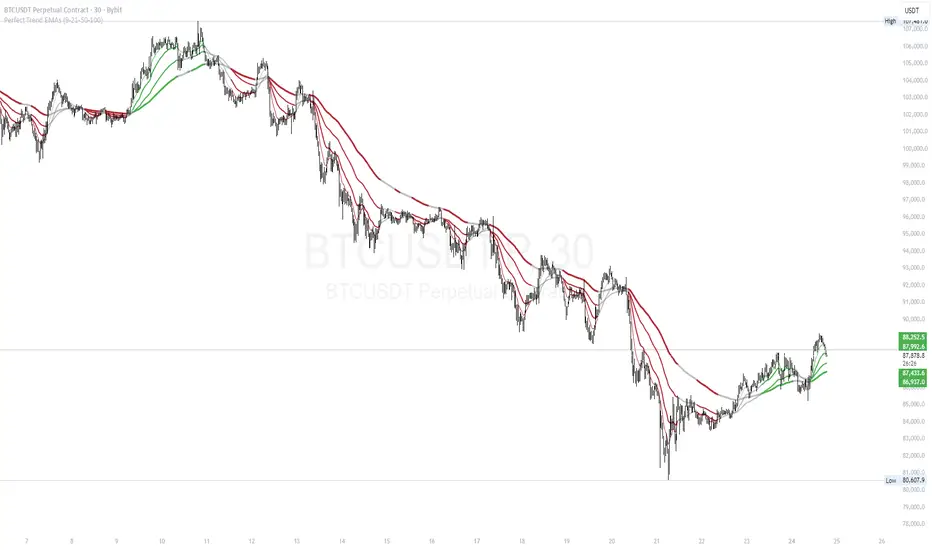
This indicator provides a clear, color-coded visual representation of trend strength based on the alignment of four Exponential Moving Averages (EMAs). It is designed to help traders identify "Perfect Trend" setups, where momentum is fully aligned across multiple timeframes, and filter out choppy or ranging markets.
How it Works (The Logic) The indicator plots four distinct EMAs (default lengths: 9, 21, 50, and 100). Instead of simply looking for crossovers, this script analyzes the hierarchical stacking of these averages to determine the market state.
The color coding follows these specific rules:
🟢 Bullish Alignment (Green): This occurs only when there is a "Perfect Bullish" stack.
Logic: EMA 9 > EMA 21 > EMA 50 > EMA 100
Interpretation: Short-term momentum is stronger than long-term momentum, indicating a strong uptrend.
🔴 Bearish Alignment (Red): This occurs only when there is a "Perfect Bearish" stack.
Logic: EMA 9 < EMA 21 < EMA 50 < EMA 100
Interpretation: Short-term momentum is weaker than long-term momentum, indicating a strong downtrend.
⚪ Consolidation / Transition (Gray):
Logic: Any other combination.
Interpretation: The moving averages are intertwined or not perfectly aligned. This usually signals a ranging market, a consolidation phase, or the early stages of a trend reversal before the alignment is confirmed.
Features
Dynamic Coloring: All EMA lines change color simultaneously to provide an instant visual signal of the market state.
Visual Fill: A soft background fill is applied between the fastest (9) and slowest (100) EMA to create a "Trend Cloud," making it easier to spot the expansion and contraction of the trend.
Customization: Users can adjust the lengths of all four EMAs in the settings menu to fit different trading styles (e.g., changing to 20/50/100/200).
How to Use
Trend Following: Traders can look for the lines to turn Green or Red to confirm a trend entry.
Filtering Noise: The Gray zones serve as a filter. If the lines are Gray, the trend is not fully established, suggesting caution or a "wait and see" approach.
Exits: A change from Green/Red back to Gray can act as an early warning sign that the trend momentum is fading.
开源脚本
秉承TradingView的精神,该脚本的作者将其开源,以便交易者可以查看和验证其功能。向作者致敬!您可以免费使用该脚本,但请记住,重新发布代码须遵守我们的网站规则。
免责声明
这些信息和出版物并非旨在提供,也不构成TradingView提供或认可的任何形式的财务、投资、交易或其他类型的建议或推荐。请阅读使用条款了解更多信息。
免责声明
这些信息和出版物并非旨在提供,也不构成TradingView提供或认可的任何形式的财务、投资、交易或其他类型的建议或推荐。请阅读使用条款了解更多信息。