PROTECTED SOURCE SCRIPT
Buy The F*cking Dip [DotGain]

How to Interpret the "Buy The F*cking Dip" (BTFD) Indicator
Main Purpose and Timeframe
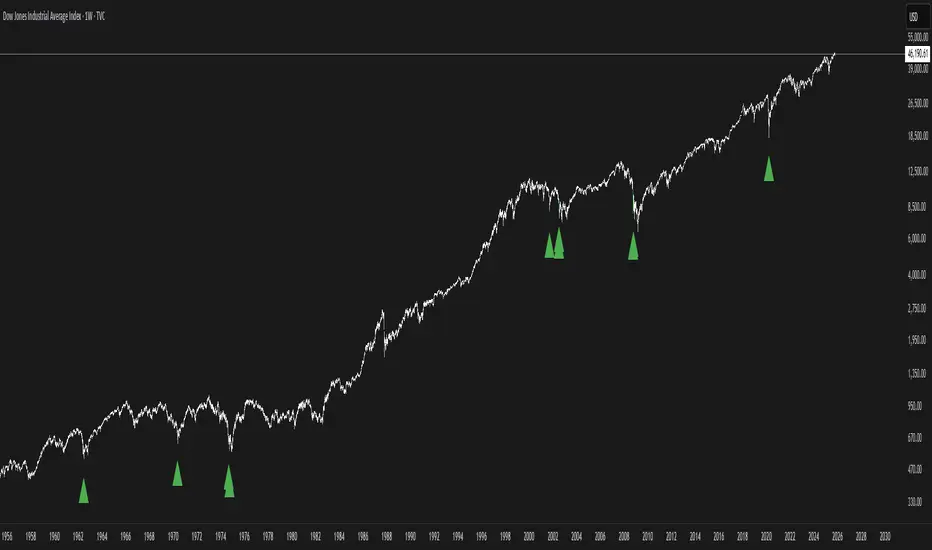
The BTFD indicator is a confluence indicator designed to identify rare moments of extreme capitulation and panic in the market. As the name suggests, its primary focus is identifying significant buying opportunities ("Dips") on high timeframes.
The Buy Signal (Green Triangle)
A green "Buy" triangle appears only when all three of the following conditions are met simultaneously. It signals not just a minor pullback, but a potentially macro-level oversold condition.
The Sell Signal (Red Triangle)
The indicator can also identify the exact opposite: moments of extreme euphoria or "blow-off tops."
Visual Adjustments (In the "Style" Tab)
By default, only the green "Buy" triangle is active. You can, however, enable other visuals in the indicator's "Style" settings tab:
Have fun :)
Disclaimer
This "Buy The F*cking Dip" (BTFD) indicator is provided for informational and educational purposes only. It does not, and should not be construed as, financial, investment, or trading advice.
The signals generated by this tool (both "Buy" and "Sell") are the result of a specific set of algorithmic conditions. They are not a direct recommendation to buy or sell any asset. All trading and investing in financial markets involves substantial risk of loss. You can lose all of your invested capital.
Past performance is not indicative of future results. The signals generated may produce false or losing trades. The creator (© DotGain) assumes no liability for any financial losses or damages you may incur as a result of using this indicator.
You are solely responsible for your own trading and investment decisions. Always conduct your own research (DYOR) and consider your personal risk tolerance before making any trades.
Main Purpose and Timeframe
The BTFD indicator is a confluence indicator designed to identify rare moments of extreme capitulation and panic in the market. As the name suggests, its primary focus is identifying significant buying opportunities ("Dips") on high timeframes.
- Recommended Timeframes: Minimum Daily chart, ideally Weekly chart.
- Primary Signal: The green "Buy" triangle is the default signal to watch for.
The Buy Signal (Green Triangle)
A green "Buy" triangle appears only when all three of the following conditions are met simultaneously. It signals not just a minor pullback, but a potentially macro-level oversold condition.
- High Panic (CM Williams Vix Fix): The market is in a state of heightened volatility or "fear." This indicates that sellers are acting out of panic.
- Structurally Oversold (Deviation from MA): The price has deviated extremely far (default: >10%) below its long-term moving average (default: 200-period EMA). This signals that the price is "cheap" in the big picture.
- Short-Term Overextended (TRMAD): The price has fallen extremely hard and fast relative to its recent volatility (ATR) (default: < -3.0). This signals "maximum pain" on a short-term level.
The Sell Signal (Red Triangle)
The indicator can also identify the exact opposite: moments of extreme euphoria or "blow-off tops."
- Disabled by Default: The red "Sell" triangle is disabled by default in the settings (display=display.none), as the indicator's focus is on buying.
- Meaning (if enabled): It signals that the market (1) has high volatility, (2) is structurally overbought (far above its 200 MA), and (3) is extremely overextended (euphoric) on a short-term basis.
Visual Adjustments (In the "Style" Tab)
By default, only the green "Buy" triangle is active. You can, however, enable other visuals in the indicator's "Style" settings tab:
- Buy (Green Triangle): On by default.
- Sell (Red Triangle): Off by default.
- Signal Bar Color: Colors the candle green/red. Off by default.
- Signal Background: Shows a transparent green/red background. Off by default.
Have fun :)
Disclaimer
This "Buy The F*cking Dip" (BTFD) indicator is provided for informational and educational purposes only. It does not, and should not be construed as, financial, investment, or trading advice.
The signals generated by this tool (both "Buy" and "Sell") are the result of a specific set of algorithmic conditions. They are not a direct recommendation to buy or sell any asset. All trading and investing in financial markets involves substantial risk of loss. You can lose all of your invested capital.
Past performance is not indicative of future results. The signals generated may produce false or losing trades. The creator (© DotGain) assumes no liability for any financial losses or damages you may incur as a result of using this indicator.
You are solely responsible for your own trading and investment decisions. Always conduct your own research (DYOR) and consider your personal risk tolerance before making any trades.
受保护脚本
此脚本以闭源形式发布。 但是,您可以自由使用,没有任何限制 — 了解更多信息这里。
免责声明
这些信息和出版物并非旨在提供,也不构成TradingView提供或认可的任何形式的财务、投资、交易或其他类型的建议或推荐。请阅读使用条款了解更多信息。
受保护脚本
此脚本以闭源形式发布。 但是,您可以自由使用,没有任何限制 — 了解更多信息这里。
免责声明
这些信息和出版物并非旨在提供,也不构成TradingView提供或认可的任何形式的财务、投资、交易或其他类型的建议或推荐。请阅读使用条款了解更多信息。