OPEN-SOURCE SCRIPT
已更新 Smooth RSI [MarktQuant]
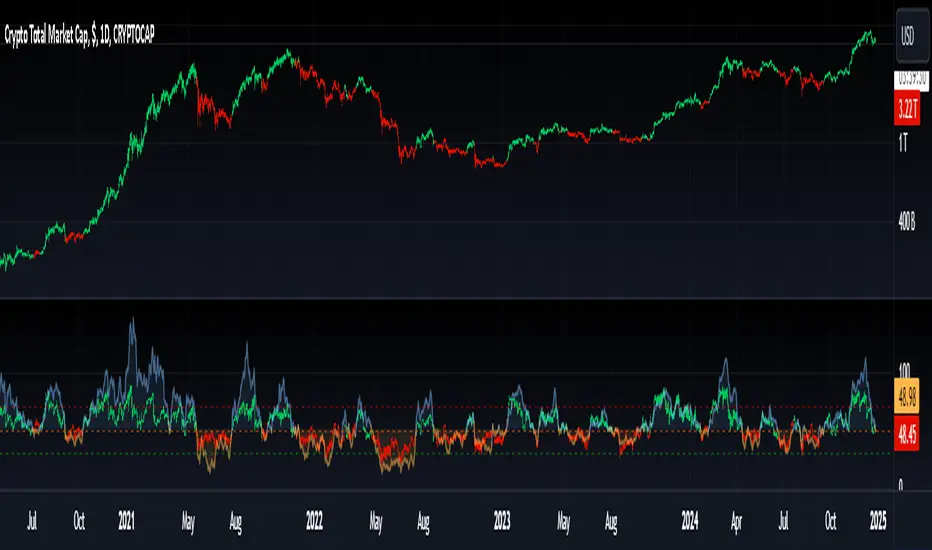
This indicator combines elements of the Relative Strength Index (RSI) and Rate of Change (RoC) to provide a smoother and potentially more insightful view of market momentum and price movement. The Smooth RSI [MarktQuant] calculates RSI values across four price points (high, open, low, close) to average them, offering a less volatile RSI signal. Additionally, it incorporates a Rate of Change for trend confirmation, enhancing the decision-making process for trade entries and exits.
Features:
Visual Signals:

Customizable Display:
Inputs:
Usage:
Long signals are indicated when the average RSI is above 50 and the RoC is positive.
Short signals are suggested when the average RSI falls below 50 with a negative RoC.
The color coding helps visually confirm trends at a glance.
Notes:
This indicator is best used in conjunction with other analysis methods to confirm signals.
Adjust the length parameters based on your trading timeframe for optimal results.
Disclaimer:
This indicator does not guarantee trading success; use it as part of a comprehensive trading strategy. Always conduct your own analysis before making trading decisions.
Features:
- Multi-RSI Calculation: RSI is computed for high, open, low, and close prices, then averaged to reduce noise.
- Trend Confirmation with RoC: Uses the Rate of Change to validate the RSI signals, coloring bars based on the trend direction.
Visual Signals:
- Bar colors change based on combined RSI and RoC signals.
- Green for bullish signals (RSI above 50 and positive RoC).
- Red for bearish signals (RSI below 50 and negative RoC).
- Horizontal lines at 30, 50, and 70 to denote overbought, neutral, and oversold conditions.
Customizable Display:
- Option to show/hide RSI plot or RoC plot for cleaner charts.
- Candle plot overlay option to visualize current price action alongside the indicator.
Inputs:
- RSI Length: Default 28. Adjusts the lookback period for RSI calculation.
- RoC Length: Default 28. Sets the period for the Rate of Change calculation.
- Plot Settings:
- Show RSI - Toggle RSI plot visibility.
- Show RoC - Toggle RoC plot visibility.
Usage:
Long signals are indicated when the average RSI is above 50 and the RoC is positive.
Short signals are suggested when the average RSI falls below 50 with a negative RoC.
The color coding helps visually confirm trends at a glance.
Notes:
This indicator is best used in conjunction with other analysis methods to confirm signals.
Adjust the length parameters based on your trading timeframe for optimal results.
Disclaimer:
This indicator does not guarantee trading success; use it as part of a comprehensive trading strategy. Always conduct your own analysis before making trading decisions.
版本注释
.开源脚本
秉承TradingView的精神,该脚本的作者将其开源,以便交易者可以查看和验证其功能。向作者致敬!您可以免费使用该脚本,但请记住,重新发布代码须遵守我们的网站规则。
🔍 Access Investing Strategies & Indicators
📊 whop.com/marktquant
🌐 marktquant.com
Nothing shared on this page constitutes financial advice. All information, tools, and analyses are provided solely for informational and educational purposes.
📊 whop.com/marktquant
🌐 marktquant.com
Nothing shared on this page constitutes financial advice. All information, tools, and analyses are provided solely for informational and educational purposes.
免责声明
这些信息和出版物并非旨在提供,也不构成TradingView提供或认可的任何形式的财务、投资、交易或其他类型的建议或推荐。请阅读使用条款了解更多信息。
开源脚本
秉承TradingView的精神,该脚本的作者将其开源,以便交易者可以查看和验证其功能。向作者致敬!您可以免费使用该脚本,但请记住,重新发布代码须遵守我们的网站规则。
🔍 Access Investing Strategies & Indicators
📊 whop.com/marktquant
🌐 marktquant.com
Nothing shared on this page constitutes financial advice. All information, tools, and analyses are provided solely for informational and educational purposes.
📊 whop.com/marktquant
🌐 marktquant.com
Nothing shared on this page constitutes financial advice. All information, tools, and analyses are provided solely for informational and educational purposes.
免责声明
这些信息和出版物并非旨在提供,也不构成TradingView提供或认可的任何形式的财务、投资、交易或其他类型的建议或推荐。请阅读使用条款了解更多信息。