PROTECTED SOURCE SCRIPT
Nexural DI Pressure Imbalance
Nexural DI Pressure Imbalance
Overview
This indicator combines traditional Directional Index (DI) analysis with modern order flow concepts to help you identify buying and selling pressure in the market. I built this because I wanted something that goes beyond basic DI calculations and actually shows what's happening inside each candle.
What Makes This Different
Instead of just looking at directional movement, this indicator analyzes:
Candle-by-candle pressure - Where did the price actually close within the candle's range? This tells us who won the battle between buyers and sellers.
Volume-weighted calculations - Low volume moves get less weight, because they're less reliable.
Order flow approximation - Estimates buying versus selling volume based on price action and where the close ended up.
Cumulative delta - Tracks the running total of buy/sell imbalance over your chosen period.
How to Read It
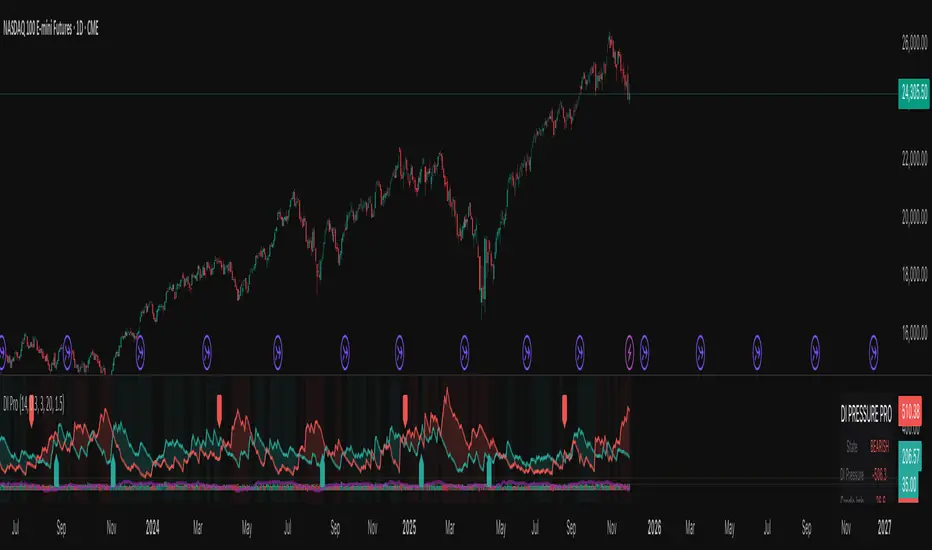
The main display shows two lines:
DI+ (green) - Buying pressure
DI- (red) - Selling pressure
When DI+ is above DI-, buyers are in control. When DI- is on top, sellers have the edge.
The volume bars at the bottom change color based on whether the candle was bought or sold, with brighter colors indicating stronger order flow.
The candle imbalance histogram (middle section) shows you the internal pressure within each candle. Positive values mean the close was near the high, negative means it closed near the low.
The purple cumulative delta line tracks the overall buying/selling imbalance over time. When it's rising, there's more buying volume. When falling, more selling.
Info Table
The table in the top-right gives you a quick summary:
State - Current market condition (Strong Buy, Bullish, Bearish, Strong Sell)
DI Pressure - Net directional pressure
Candle Imb - Current candle imbalance score
Delta - Cumulative volume delta
Composite - Combined score from all components
Volume - Current volume level (Low, Normal, High, Extreme, Strong)
Flow - Order flow strength (Weak, Moderate, Strong)
Settings You Can Adjust
Core Settings:
DI Length - How many periods to use for DI calculation (default 14)
Volume Weighting - Whether to reduce the impact of low volume bars
ATR Normalization - Scales the indicator to match current volatility
Low Volume Threshold - What counts as "low volume" (default 0.3 = 30% of average)
Candle Analysis:
Imbalance Smoothing - How much to smooth the candle imbalance line
Delta Lookback Period - How far back to track cumulative delta
Order Flow:
Flow Sensitivity - Higher values = stricter requirements for "strong flow" signals
Visual:
Toggle various display elements on/off to clean up your chart
Alerts
The indicator includes several alert conditions:
Strong buy/sell signals (DI crossovers with strong volume)
Candle imbalance flips (pressure shifts)
Extreme pressure conditions (composite score above 70 or below -70)
Divergences between price and indicator
Strong order flow detection
Best Use Cases
This works well for:
Confirming trend strength
Identifying potential reversals when price and pressure diverge
Spotting low-conviction moves (weak volume plus conflicting signals)
Finding high-probability entries when all components align
A Few Notes
Low volume periods get a gray background warning - be careful with signals during these times
The indicator combines multiple analysis methods, so you're getting a more complete picture than any single metric alone
Extreme readings (bright green/red backgrounds) often precede reversals or consolidation
Works on any timeframe, though I find it most useful on 5-minute charts and up
This is not a magic bullet, but it does help you see what's actually happening beneath price action. Use it alongside your other analysis tools and always manage your risk.
Overview
This indicator combines traditional Directional Index (DI) analysis with modern order flow concepts to help you identify buying and selling pressure in the market. I built this because I wanted something that goes beyond basic DI calculations and actually shows what's happening inside each candle.
What Makes This Different
Instead of just looking at directional movement, this indicator analyzes:
Candle-by-candle pressure - Where did the price actually close within the candle's range? This tells us who won the battle between buyers and sellers.
Volume-weighted calculations - Low volume moves get less weight, because they're less reliable.
Order flow approximation - Estimates buying versus selling volume based on price action and where the close ended up.
Cumulative delta - Tracks the running total of buy/sell imbalance over your chosen period.
How to Read It
The main display shows two lines:
DI+ (green) - Buying pressure
DI- (red) - Selling pressure
When DI+ is above DI-, buyers are in control. When DI- is on top, sellers have the edge.
The volume bars at the bottom change color based on whether the candle was bought or sold, with brighter colors indicating stronger order flow.
The candle imbalance histogram (middle section) shows you the internal pressure within each candle. Positive values mean the close was near the high, negative means it closed near the low.
The purple cumulative delta line tracks the overall buying/selling imbalance over time. When it's rising, there's more buying volume. When falling, more selling.
Info Table
The table in the top-right gives you a quick summary:
State - Current market condition (Strong Buy, Bullish, Bearish, Strong Sell)
DI Pressure - Net directional pressure
Candle Imb - Current candle imbalance score
Delta - Cumulative volume delta
Composite - Combined score from all components
Volume - Current volume level (Low, Normal, High, Extreme, Strong)
Flow - Order flow strength (Weak, Moderate, Strong)
Settings You Can Adjust
Core Settings:
DI Length - How many periods to use for DI calculation (default 14)
Volume Weighting - Whether to reduce the impact of low volume bars
ATR Normalization - Scales the indicator to match current volatility
Low Volume Threshold - What counts as "low volume" (default 0.3 = 30% of average)
Candle Analysis:
Imbalance Smoothing - How much to smooth the candle imbalance line
Delta Lookback Period - How far back to track cumulative delta
Order Flow:
Flow Sensitivity - Higher values = stricter requirements for "strong flow" signals
Visual:
Toggle various display elements on/off to clean up your chart
Alerts
The indicator includes several alert conditions:
Strong buy/sell signals (DI crossovers with strong volume)
Candle imbalance flips (pressure shifts)
Extreme pressure conditions (composite score above 70 or below -70)
Divergences between price and indicator
Strong order flow detection
Best Use Cases
This works well for:
Confirming trend strength
Identifying potential reversals when price and pressure diverge
Spotting low-conviction moves (weak volume plus conflicting signals)
Finding high-probability entries when all components align
A Few Notes
Low volume periods get a gray background warning - be careful with signals during these times
The indicator combines multiple analysis methods, so you're getting a more complete picture than any single metric alone
Extreme readings (bright green/red backgrounds) often precede reversals or consolidation
Works on any timeframe, though I find it most useful on 5-minute charts and up
This is not a magic bullet, but it does help you see what's actually happening beneath price action. Use it alongside your other analysis tools and always manage your risk.
受保护脚本
此脚本以闭源形式发布。 但是,您可以自由使用,没有任何限制 — 了解更多信息这里。
Risk Management > Everything else
免责声明
这些信息和出版物并非旨在提供,也不构成TradingView提供或认可的任何形式的财务、投资、交易或其他类型的建议或推荐。请阅读使用条款了解更多信息。
免责声明
这些信息和出版物并非旨在提供,也不构成TradingView提供或认可的任何形式的财务、投资、交易或其他类型的建议或推荐。请阅读使用条款了解更多信息。