OPEN-SOURCE SCRIPT
ATR Based Zigzag w EMA
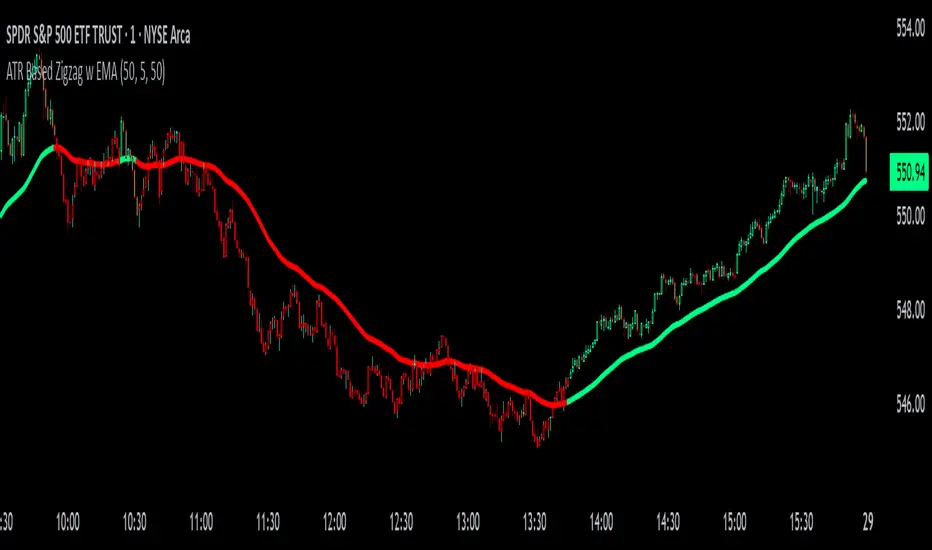
The "ATR Based Zigzag with EMA" indicator is a refined trend-following tool designed for traders who demand clarity, precision, and robust trend detection. This script uses an ATR (Average True Range)-based breakout mechanism to dynamically determine the current market trend, while overlaying a clean, smoothed EMA (Exponential Moving Average) line to visually represent the active directional bias.
The indicator continuously tracks new swing highs and lows based on ATR volatility thresholds. When price moves sufficiently against the current trend — exceeding an ATR-multiplied distance — the trend is considered reversed. This adaptive method ensures that trend flips are based not on arbitrary price action, but on meaningful, volatility-adjusted movements.
Instead of plotting zigzag-style pivots which can create visual noise, the indicator draws a single, smooth EMA line calculated from the median price ((high + low) / 2). The color of the line shifts instantly based on the active trend: green (or your customized color) for uptrends, and red for downtrends. In addition, individual price bars are optionally colored to match the trend, further enhancing at-a-glance clarity without cluttering the chart.
Key user-defined inputs include the ATR length, ATR multiplier (sensitivity for trend flips), EMA smoothing length (responsiveness of the trend line), and full color customization for uptrend and downtrend states.
This indicator excels at providing a clear and immediate understanding of trend conditions, making it highly effective for:
Trend-following strategies
Reversal spotting based on volatility breaks
Entry/exit confirmation
Visual chart cleanliness and minimalism
Whether used standalone or alongside other tools, the "ATR Based Zigzag with EMA" offers a disciplined, volatility-sensitive view of market structure — engineered for traders who refuse to tolerate noise, hesitation, or ambiguity in their decision-making.
开源脚本
秉承TradingView的精神,该脚本的作者将其开源,以便交易者可以查看和验证其功能。向作者致敬!您可以免费使用该脚本,但请记住,重新发布代码须遵守我们的网站规则。
免责声明
这些信息和出版物并非旨在提供,也不构成TradingView提供或认可的任何形式的财务、投资、交易或其他类型的建议或推荐。请阅读使用条款了解更多信息。
开源脚本
秉承TradingView的精神,该脚本的作者将其开源,以便交易者可以查看和验证其功能。向作者致敬!您可以免费使用该脚本,但请记住,重新发布代码须遵守我们的网站规则。
免责声明
这些信息和出版物并非旨在提供,也不构成TradingView提供或认可的任何形式的财务、投资、交易或其他类型的建议或推荐。请阅读使用条款了解更多信息。