OPEN-SOURCE SCRIPT
Tri-Fold BB(Trend-Strength)
*indicator isn't preset to look as displayed, do so accordingly*
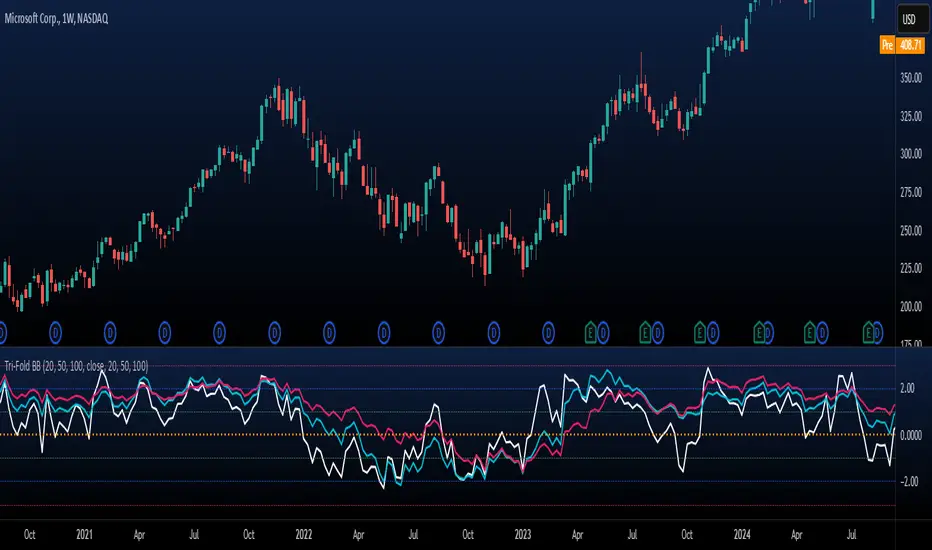
"Tri-Fold BB" is an indicator that utilizes three Bollinger Bands, each of different length as a way to represent trend strength. This allows one to see the trend strength relative to multiple timeframes: short, mid, and long term trend strength. This is helpful because it provides the user with a holistic view of the asset.
How it Works
The indicator is preset to utilizing three different Bollinger Bands with length: 20, 50, and 100. This indicator simply plots the price of an asset relative to its specified Bollinger Band. For an example, if the price of the asset were to surpass its 20BB standard deviations, it would display so accordingly, though from the perspective of lets say... the 100, it may have looked like it barely moved up a standard deviation relative to 100BB because the standard deviations of a 100BB are more spread out.
Its important to view the trend strength from multiple lengths because it allows one to gauge whether the short term trend strength is likely to hold or not. A better way to speculate on asset behavior.
Another way to view this indicator is similar to that of the BB% indicator, except this indicator allows us to view price relative to standard deviations, across multiple timeframes. More holistic, more utility provided.
Basic Understanding:
Each line = Standard Deviation (3 upper, 3 lower)
Mid-Line = Basis relative to BB(20sma, 50sma, 100sma)
If price goes under Basis, that means it crossed below their specified sma(significant bull or bear signal)
I've also added HMA's relative to each BB incase one were to decide in creating some sort of trading strategy with it. I personally don't use them but I understand that it could be helpful to some so I left it in there. If you don't like them then simply deselect them and then save your desired setup as default.
In regard to regular indications of bullish or bearishness, i'd like to add that I use this indicator for the sole purpose of providing an idea of trend strength. I personally am unsure to state that cross overs directly indicate that there is a bull or bear move because I've seen instances where the price of an asset went in a direction contrary to what it 'should' have if we were to use that cross over strategy. Though of course, feel free to use this indicator as desired.
开源脚本
秉承TradingView的精神,该脚本的作者将其开源,以便交易者可以查看和验证其功能。向作者致敬!您可以免费使用该脚本,但请记住,重新发布代码须遵守我们的网站规则。
免责声明
这些信息和出版物并非旨在提供,也不构成TradingView提供或认可的任何形式的财务、投资、交易或其他类型的建议或推荐。请阅读使用条款了解更多信息。
免责声明
这些信息和出版物并非旨在提供,也不构成TradingView提供或认可的任何形式的财务、投资、交易或其他类型的建议或推荐。请阅读使用条款了解更多信息。