OPEN-SOURCE SCRIPT
S&P 500 Weighted Advance Decline Line
S&P 500 Weighted Advance Decline Line Indicator
Overview
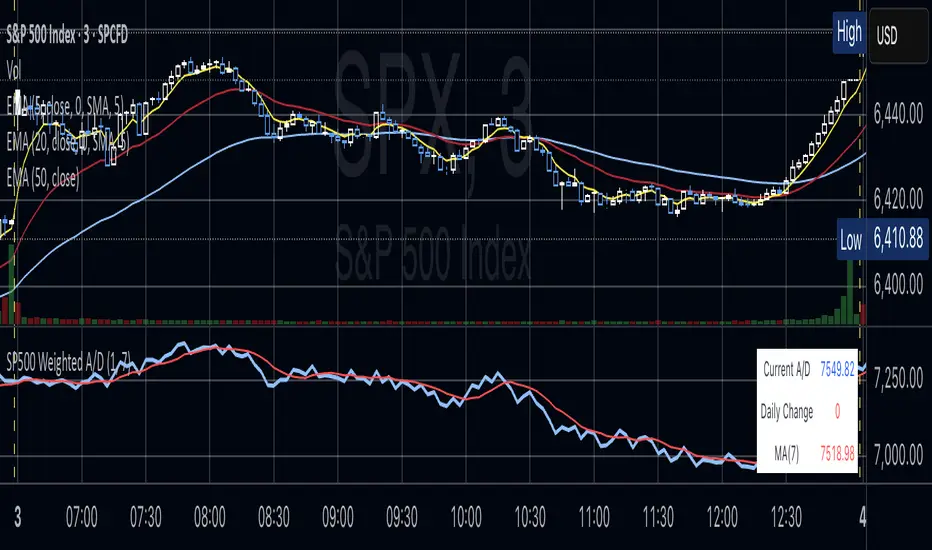
This indicator creates a market cap weighted advance/decline line for the S&P 500 that tracks breadth based on actual index weights rather than treating all stocks equally. By weighting each stock's contribution according to its true S&P 500 impact, it provides more accurate market breadth analysis and better insights into underlying market strength and potential turning points.
Key Features
Stock Coverage
Sector Breakdown:
Technology (29.8%) - Dominates the coverage as expected
Financials (5.8%) - Major banking and payment companies
Consumer/Retail (3.7%) - Consumer staples and retail giants
Healthcare (3.2%) - Pharma and healthcare services
Communication (1.97%) - Telecom and tech services
Energy (1.35%) - Oil and gas majors
Industrial (0.9%) - Aerospace and industrial equipment
Other Sectors (4.6%) - Miscellaneous including software and payments
Includes the 40 largest S&P 500 companies by weight, featuring:
How to Interpret
Trend Signals
Divergence Analysis
Confirmation
Settings
Limitations
Overview
This indicator creates a market cap weighted advance/decline line for the S&P 500 that tracks breadth based on actual index weights rather than treating all stocks equally. By weighting each stock's contribution according to its true S&P 500 impact, it provides more accurate market breadth analysis and better insights into underlying market strength and potential turning points.
Key Features
- Market Cap Weighted: Each stock contributes based on its actual S&P 500 weight
- Top 40 Stocks: Covers ~51% of the index with the largest companies
(limited by TradingView's 40 security call maximum for Premium accounts) - Real-Time Updates: Cumulative line shows long-term breadth trends
- Visual Indicators: Background coloring, moving average option, and data table
Stock Coverage
Sector Breakdown:
Technology (29.8%) - Dominates the coverage as expected
Financials (5.8%) - Major banking and payment companies
Consumer/Retail (3.7%) - Consumer staples and retail giants
Healthcare (3.2%) - Pharma and healthcare services
Communication (1.97%) - Telecom and tech services
Energy (1.35%) - Oil and gas majors
Industrial (0.9%) - Aerospace and industrial equipment
Other Sectors (4.6%) - Miscellaneous including software and payments
Includes the 40 largest S&P 500 companies by weight, featuring:
- Tech Leaders (29.8%): AAPL (7.0%), MSFT (6.5%), NVDA (4.5%), AMZN (3.5%), META (2.5%), GOOGL/GOOG (3.8%), AVGO (1.5%), ORCL (1.22%), AMD (0.51%), plus others
- Financials (5.8%): BRK.B (1.8%), JPM (1.2%), V (1.0%), MA (0.8%), BAC (0.63%), WFC (0.46%)
- Healthcare (3.2%): LLY (1.2%), UNH (1.2%), JNJ (1.1%), ABBV (0.8%), PG (0.9%)
- Consumer/Retail (3.7%): WMT (0.8%), HD (0.8%), COST (0.7%), KO (0.6%), PEP (0.6%), NKE (0.4%)
- Communication (1.97%): TMUS (0.47%), CSCO (0.47%), DIS (0.5%), CRM (0.5%)
- Energy** (1.35%): XOM (0.8%), CVX (0.55%)
- Industrial** (0.9%): GE (0.5%), BA (0.4%)
- Other Sectors (4.6%): PLTR (0.65%), ADBE (0.6%), PYPL (0.3%), plus others
How to Interpret
Trend Signals
- Rising A/D Line: Broad market strength, more weighted buying than selling
- Falling A/D Line: Market weakness, more weighted selling pressure
- Flat A/D Line: Balanced market conditions
Divergence Analysis
- Bullish Divergence: S&P 500 makes new lows but A/D Line holds higher
- Bearish Divergence: S&P 500 makes new highs but A/D Line fails to confirm
Confirmation
- Strong trends occur when both price and A/D Line move in the same direction
- Weak trends show when price moves but breadth doesn't follow
Settings
- Lookback Period: Days for advance/decline comparison (default: 1)
- Show Moving Average: Optional trend smoothing
- MA Length: Moving average period (default: 20)
Limitations
- Covers ~51% of S&P 500 (not complete market breadth)
- Optimized for TradingView Premium accounts (40 security limit)
- Heavy weighting toward mega-cap technology stocks
- Dependent on real-time data quality
开源脚本
秉承TradingView的精神,该脚本的作者将其开源,以便交易者可以查看和验证其功能。向作者致敬!您可以免费使用该脚本,但请记住,重新发布代码须遵守我们的网站规则。
免责声明
这些信息和出版物并非旨在提供,也不构成TradingView提供或认可的任何形式的财务、投资、交易或其他类型的建议或推荐。请阅读使用条款了解更多信息。
免责声明
这些信息和出版物并非旨在提供,也不构成TradingView提供或认可的任何形式的财务、投资、交易或其他类型的建议或推荐。请阅读使用条款了解更多信息。