OPEN-SOURCE SCRIPT
已更新 Volume DMAO [DCAUT]
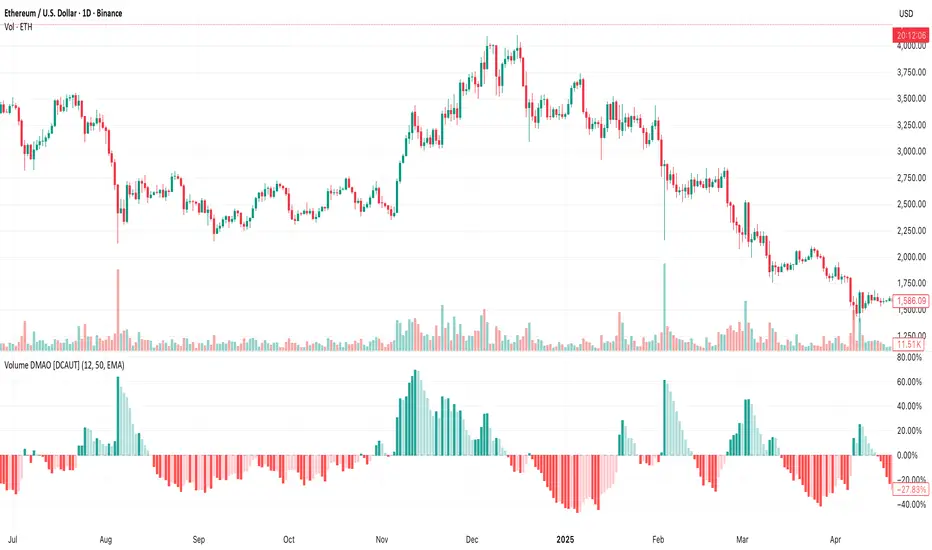
█ Volume DMAO Indicator [DCAUT]
📊 OVERVIEW
The Volume DMAO (Dual Moving Average Oscillator) applies PPO-style calculation to volume data rather than price. It measures the percentage difference between fast and slow moving averages of volume, providing insights into volume momentum and market participation trends.
🎯 CONCEPTS
Signal Interpretation
Primary Applications
📋 PARAMETER SETUP
Input Parameters
📊 COLOR CODING
Histogram Colors
💡 CORE VALUE
Unlike traditional volume indicators, Volume DMAO provides normalized percentage readings that:
- Enable comparison across different timeframes and instruments
- Reveal volume momentum changes before price movements
- Identify market phases through volume participation analysis
📊 OVERVIEW
The Volume DMAO (Dual Moving Average Oscillator) applies PPO-style calculation to volume data rather than price. It measures the percentage difference between fast and slow moving averages of volume, providing insights into volume momentum and market participation trends.
🎯 CONCEPTS
Signal Interpretation
- Positive Values: Current volume above historical average (expansion phase)
- Negative Values: Current volume below historical average (contraction phase)
- Rising Trend: Volume momentum accelerating (increasing participation)
- Falling Trend: Volume momentum decelerating (decreasing participation)
Primary Applications
- Volume Confirmation: Validate price movements with volume momentum analysis
- Divergence Detection: Spot potential reversals when volume diverges from price
- Trend Strength: Assess volume participation in price trends
- Entry/Exit Signals: Time trades based on volume momentum shifts
📋 PARAMETER SETUP
Input Parameters
- Fast Length: Period for fast moving average (default: 12)
- Slow Length: Period for slow moving average (default: 50)
- MA Type: Moving average algorithm (default: EMA)
📊 COLOR CODING
Histogram Colors
- Dark Green: Positive and rising (strong volume expansion)
- Light Green: Positive and falling (weakening volume expansion)
- Light Red: Negative and rising (recovering from volume contraction)
- Dark Red: Negative and falling (strong volume contraction)
💡 CORE VALUE
Unlike traditional volume indicators, Volume DMAO provides normalized percentage readings that:
- Enable comparison across different timeframes and instruments
- Reveal volume momentum changes before price movements
- Identify market phases through volume participation analysis
版本注释
📌 ADDITIONAL INFORMATIONMathematical Foundation:
Volume DMAO employs percentage difference calculation methodology with the core mathematical formula:
Core Algorithm:
• Fast Volume MA: MA(volume, fastLength, maType)
• Slow Volume MA: MA(volume, slowLength, maType)
• Volume DMAO = ((Fast MA - Slow MA) / Slow MA) × 100
• Result: Volume momentum indicator in percentage form
The calculation process:
1. Apply fast moving average to raw volume data, generating fast volume MA
2. Apply slow moving average to raw volume data, generating slow volume MA
3. Calculate the difference between the two moving averages
4. Divide the difference by slow MA to obtain relative percentage change
5. Multiply by 100 to convert to percentage form for intuitive interpretation
Originality & Technical Innovation:
Volume DMAO transforms traditional volume analysis by applying PPO (Percentage Price Oscillator) mathematical framework to volume data. Unlike conventional volume indicators that show absolute values, this provides standardized percentage readings enabling direct comparison across different instruments, timeframes, and historical periods. The indicator supports 21 moving average algorithms from SMA to Kalman Filter, allowing optimization for specific market conditions.
Advanced Signal Recognition:
• Zero line crossovers: Clear transitions between volume expansion and contraction phases
• Divergence patterns: Price making new highs with lower DMAO highs indicates buying exhaustion; price making new lows with higher DMAO lows indicates weakening selling pressure
• Extreme readings: Significant deviations from zero line may indicate abnormal market activity or important events
• Sustained territories: Positive territory supports trend continuation, negative territory warns of reversal risk
Strategic Application Methods:
• Trend Confirmation: Validate breakouts by combining price action with DMAO zero line crossovers. Higher DMAO values indicate stronger volume support
• Entry/Exit Timing: Enter when price breakout aligns with DMAO zero line cross. Exit on divergences or territory reversals
• Multi-Timeframe Analysis: Use longer timeframes for trend direction, shorter for precise entry timing. Higher confidence when DMAO aligns across timeframes
• Risk Management: Adjust position size based on DMAO strength. Reduce exposure when DMAO negative values expand
Parameter Configuration Details:
• Fast Length (Default: 12): Controls short-term sensitivity. Shorter increases responsiveness but adds noise
• Slow Length (Default: 50): Defines long-term baseline. Should be 3-5x longer than fast length for effective momentum contrast
• MA Type Options: EMA (balanced, default), SMA (most stable), HMA (reduced lag), Adaptive types (KAMA, ALMA, T3) for varying conditions, Kalman Filter for high noise environments
• Optimization: Match parameters to trading timeframe, consider market volatility, validate through backtesting, avoid overfitting
Performance Characteristics:
• Advantages: Standardized percentage output enables cross-market comparison; momentum perspective reveals volume trend changes; zero line provides clear signals
• Limitations: Inherent lag from moving averages; performance varies with parameters and market conditions; may show abnormal readings during extreme events; depends on volume data quality
• Best Application: Markets with reliable volume data (stocks, futures); daily and higher timeframes; part of comprehensive analysis with price action and risk management
Algorithm Flexibility:
The indicator supports multiple moving average types, each suited for different market conditions:
• Basic (SMA, EMA, RMA, WMA): Standard smoothing with varying response speeds
• Advanced (HMA, ALMA, T3): Reduced lag or enhanced smoothing for specific needs
• Adaptive (KAMA, FRAMA): Automatically adjust to market efficiency and fractal characteristics
• Signal Processing (Kalman Filter, Super Smoother): Optimal estimation for noisy environments
Comparative Advantages:
• vs. Volume Moving Averages: Provides standardized percentage readings rather than absolute values
• vs. OBV: Measures volume momentum intensity, not just directional accumulation
• vs. VWAP: Focuses on volume momentum rather than price-volume relationship
• Key Differentiation: Percentage form enables direct comparison across different market scales and historical periods
Usage Guidelines:
This indicator is designed for technical analysis and educational purposes. Volume DMAO helps understand volume momentum characteristics but should not be used as the sole basis for trading decisions. Performance varies with market conditions and parameter settings. Past performance does not guarantee future results. Always combine with proper risk management and validate through backtesting before live trading.
开源脚本
秉承TradingView的精神,该脚本的作者将其开源,以便交易者可以查看和验证其功能。向作者致敬!您可以免费使用该脚本,但请记住,重新发布代码须遵守我们的网站规则。
DCAUT is a professional automated bot platform. While we share indicators here for research, our ecosystem offers intelligent algorithmic solutions. Deploy advanced bots for seamless 24/7 execution.
🌐 dcaut.com
🌐 dcaut.com
免责声明
这些信息和出版物并非旨在提供,也不构成TradingView提供或认可的任何形式的财务、投资、交易或其他类型的建议或推荐。请阅读使用条款了解更多信息。
开源脚本
秉承TradingView的精神,该脚本的作者将其开源,以便交易者可以查看和验证其功能。向作者致敬!您可以免费使用该脚本,但请记住,重新发布代码须遵守我们的网站规则。
免责声明
这些信息和出版物并非旨在提供,也不构成TradingView提供或认可的任何形式的财务、投资、交易或其他类型的建议或推荐。请阅读使用条款了解更多信息。