OPEN-SOURCE SCRIPT
VWAP LEVELS [PRO]
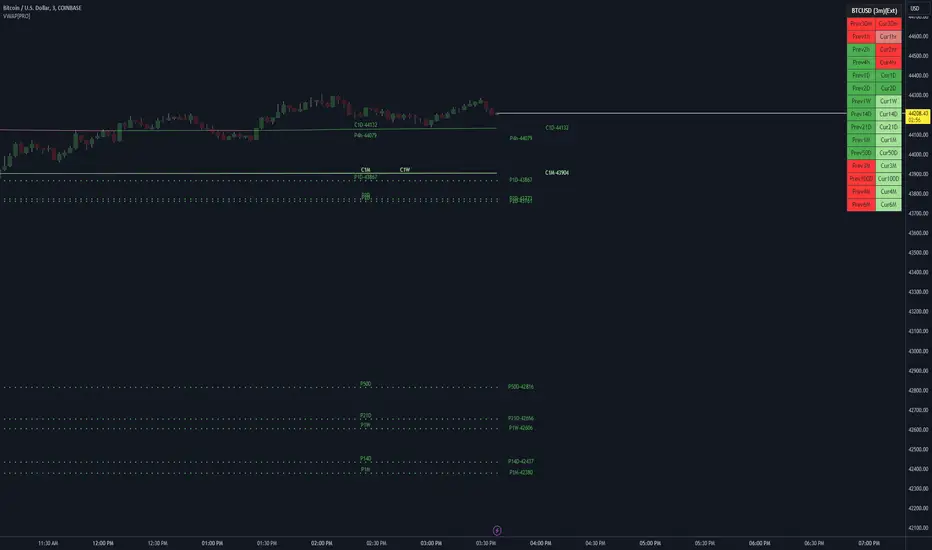
32 VWAP levels with labels and a table to help you identify quickly where current price is in relation to your favorite VWAP pivot levels. To help reduce cognitive load, 4 colors are used to show you where price is in relation to a VWAP level as well as the strength of that respective level. Ultimately, VWAP can be an invaluable source of support and resistance; in other words you'll often see price bounce off of a level (whether price is increasing or decreasing) once or multiple times and that could be an indication of a price's direction. Another way that you could utilize this indicator is to use it in confluence with other popular signals, such as an EMA crossover. Many traders will wait till a bar's close on the 5m or 10m time frame above a VWAP level (developing 1D VWAP would be a popular choice) before making a decision on a potential trade especially if price is rising above the 1D VWAP *and* there's been a recent 100 EMA cross UP of the 200 EMA. These are 2 bullish signals that you could look for before possibly entering in to a trade.
I've made this indicator extremely customizable:
⚡Each VWAP level has 2 labels: 1 "at level" and 1 "at right", each label and price can be disabled
⚡Each VWAP label has its own input for label padding. The "at right" label padding input allows you to zoom in and out of a chart without the labels moving along their respective axis. However, the "at level" label padding input doesn't work the same way once you move the label out of the "0" input. The label will move slightly when you zoom in and out
⚡Both "current" and "previous" VWAP levels have their own plot style that can be changed from circles, crosses and lines
⚡Significant figures input allows you to round a price up or down
⚡A price line that allows you to identify where price is in relation to a VWAP level
⚡A table that's color coded the same way as the labels. The labels and table cells change to 1 of 4 colors when "OC Check Mode" is enabled. This theory examines if the VWAP from the Open is above or below the VWAP from Close and if price is above or below normal VWAP (HLC3). This way we have 4 states:
Red = Strong Downtrend
Light Red = Weak Downtrend
Light = Weak Uptrend
Green = Strong Uptrend
Something to keep in mind: At the start of a new year, week or month, some levels will converge and they'll eventually diverge slowly or quickly depending on the level and/or time frame. You could add a few labels "at level" to show which levels are converging at the time. Since we're at the beginning of a new year, you'll see current month, 2 month, 3 month etc converge in to one level.
https://www.tradingview.com/x/uGjGdkAE/
🙏Thanks to (c)MartinWeb for the inspiration behind this indicator.
🙏Thanks to (c)SimpleCryptoLife for the libraries and code to help create the labels.
开源脚本
秉承TradingView的精神,该脚本的作者将其开源,以便交易者可以查看和验证其功能。向作者致敬!您可以免费使用该脚本,但请记住,重新发布代码须遵守我们的网站规则。
🆓 Free scripts:
⚡ Pro scripts: tradingview.com/script/hESCvPuH-Predictive-Volume-MTF-Pro/
🙋♂️ Get help with Pinescript: simplecrypto.life/get-help-with-pinescript
⚡ Pro scripts: tradingview.com/script/hESCvPuH-Predictive-Volume-MTF-Pro/
🙋♂️ Get help with Pinescript: simplecrypto.life/get-help-with-pinescript
免责声明
这些信息和出版物并非旨在提供,也不构成TradingView提供或认可的任何形式的财务、投资、交易或其他类型的建议或推荐。请阅读使用条款了解更多信息。