OPEN-SOURCE SCRIPT
已更新 Expected Z-Scored Price
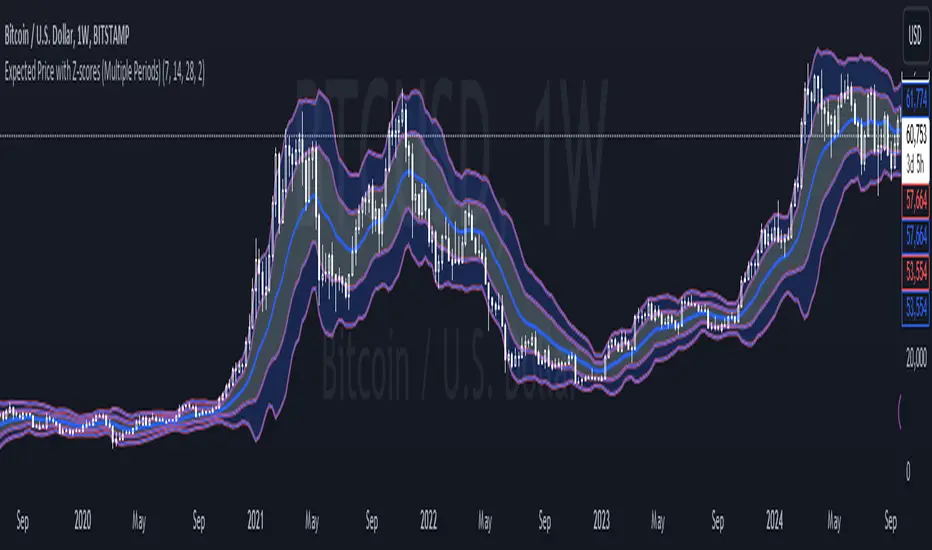
Expected Z-Scored Price is a Mean Reversion based indicator, it shows you where the price should be based on its average price and its average increase over the set previous period, indicating whether the price is under/overvalued giving a unique insight into the current value of an asset, for example  BTCUSD , however is designed for all assets that move in price.
How to read the Expected Z-scored price?
1. Zoom closer, you will see a line in the middle, this is where the price should be based on its average price and its movement
2. The lines above/below are the Standard Deviations (SD) of this expected price, if the price is in the lower price bands or even below them, it is undervalued and it is time to buy/accumulate it, if the price is above the mean (average) price, it is undervalued and should be sold.
It is that easy!
!WATCH OUT!
- This is not a Trend Following indicator, it does not indicate the prices direction, therefore if the asset is undervalued it can still go down, the bands indicate the significancy of the under/overvalueness
- It is not 100% accurate
- Watch out for the significancy of the undervalue or overvalue
Bit more info
- Each line is one SD away from the mean
- Adjusting the timeframe will help you keep the mean and its SDs on the signal period you want them to
- You can adjust the color, thickness of the lines and bands in settings
版本注释
NEW MINI UPDATE!Now one of components of Expected price Z-score is an average of 3 periods, that will be adjustable
开源脚本
本着TradingView的真正精神,此脚本的创建者将其开源,以便交易者可以查看和验证其功能。向作者致敬!虽然您可以免费使用它,但请记住,重新发布代码必须遵守我们的网站规则。
免责声明
这些信息和出版物并不意味着也不构成TradingView提供或认可的金融、投资、交易或其它类型的建议或背书。请在使用条款阅读更多信息。
开源脚本
本着TradingView的真正精神,此脚本的创建者将其开源,以便交易者可以查看和验证其功能。向作者致敬!虽然您可以免费使用它,但请记住,重新发布代码必须遵守我们的网站规则。
免责声明
这些信息和出版物并不意味着也不构成TradingView提供或认可的金融、投资、交易或其它类型的建议或背书。请在使用条款阅读更多信息。