INVITE-ONLY SCRIPT
WaveTrend Anomaly by Hypester
As requested by the Alpha community, here's our release.
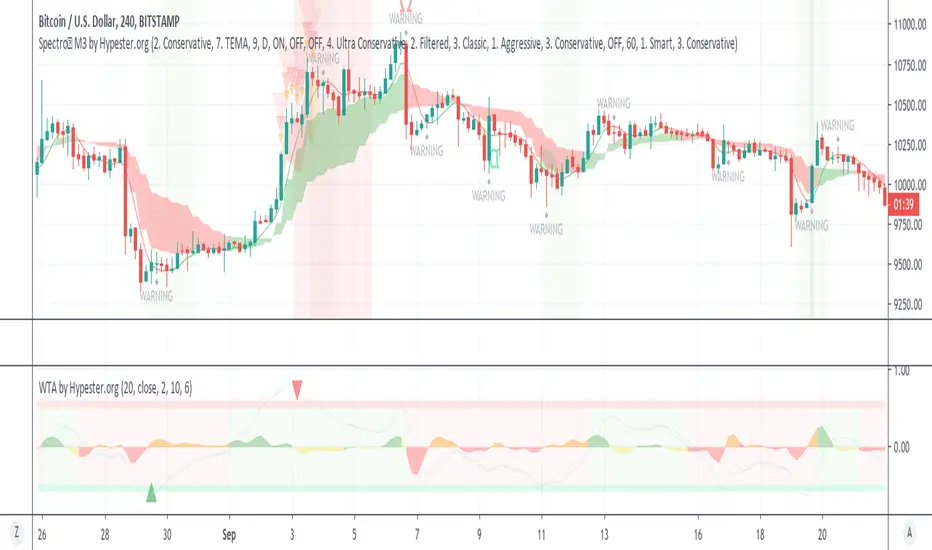
This is a different type of Wavetrend indicator; here, we have a statistical approach to the waves. We normalize the trends as a reference to measure how much every move differs from the average.
If the move is too far out, it tends to go back to the average as a rule. This indicator yields a %. As you can see, most of the moves tend to stay within 0.5 and -0.5. Remember the fact that 0.5 means 50%, the negative factor here only determines direction.
Funny the fact that most crossings happen within the 0.5 and -0.5, which means they occur before the odds are against them all the time. That highlights the chaotic nature of the markets.
However, the outliers, the moves that extrapolate the 50%, tend to go back to the average quickly, and the big triangles highlight this crossing.
You can also display every single crossing and its direction in the options panel.
There're more customization capabilities in the panel, too, like length, source, and so on.
Now to the background color options, when it's green, we have a confirmed bull movement, and red is a confirmed bear.
The area oscillator is the slope between the fast and slow oscillator lines. Here you can see when the trend is reversing or losing its strength. The orange slope color happens when you have a bearish trend, for instance. The yellow slope happens with a bull trend but a negative momentum. By mixing the colors, you can evaluate if it's strong enough for a full reversal and so on.
This same approach could be handy to spot bottoms and tops.
仅限邀请脚本
只有作者授权的用户才能访问此脚本。您需要申请并获得使用许可。通常情况下,付款后即可获得许可。更多详情,请按照下方作者的说明操作,或直接联系spectertrading。
TradingView不建议您付费购买或使用任何脚本,除非您完全信任其作者并了解其工作原理。您也可以在我们的社区脚本找到免费的开源替代方案。
作者的说明
免责声明
这些信息和出版物并非旨在提供,也不构成TradingView提供或认可的任何形式的财务、投资、交易或其他类型的建议或推荐。请阅读使用条款了解更多信息。
仅限邀请脚本
只有作者授权的用户才能访问此脚本。您需要申请并获得使用许可。通常情况下,付款后即可获得许可。更多详情,请按照下方作者的说明操作,或直接联系spectertrading。
TradingView不建议您付费购买或使用任何脚本,除非您完全信任其作者并了解其工作原理。您也可以在我们的社区脚本找到免费的开源替代方案。
作者的说明
免责声明
这些信息和出版物并非旨在提供,也不构成TradingView提供或认可的任何形式的财务、投资、交易或其他类型的建议或推荐。请阅读使用条款了解更多信息。