OPEN-SOURCE SCRIPT
已更新 Golden Area
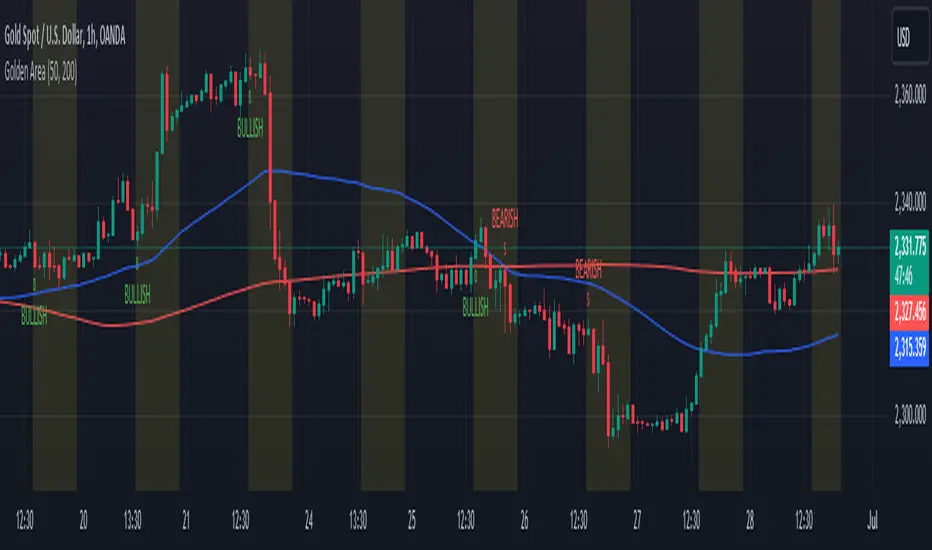
### Golden Area Indicator Description
The "Golden Area" indicator is a technical analysis tool designed to assist traders by identifying potential buy and sell signals based on moving averages and support/resistance levels within a specific time frame. This indicator can be applied directly to price charts.
#### How It Works
1. **Inputs:**
- **MA50 Length:** The period length for the 50-period Simple Moving Average (SMA).
- **MA200 Length:** The period length for the 200-period Simple Moving Average (SMA).
2. **Calculations:**
- **MA50 (50-period SMA):** Calculated by averaging the closing prices over the past 50 periods.
- **MA200 (200-period SMA):** Calculated by averaging the closing prices over the past 200 periods.
- **Support Level:** The lowest price over the last 50 periods.
- **Resistance Level:** The highest price over the last 50 periods.
3. **Time Filter:**
- **Start Time:** The indicator becomes active at 12:30 IST (07:00 UTC).
- **End Time:** The indicator deactivates at 10:30 IST the next day (05:00 UTC).
- A background color change (yellow) highlights the active time range on the chart.
4. **Signals:**
- **Buy Signal:** Triggered when the current time matches the start time and the closing price is below the support level.
- **Sell Signal:** Triggered when the current time matches the start time and the closing price is above the resistance level.
5. **Plots:**
- **MA50:** Plotted as a blue line on the chart.
- **MA200:** Plotted as a red line on the chart.
- **Buy Signals:** Indicated by a green 'B' below the bars.
- **Sell Signals:** Indicated by a red 'S' above the bars.
This indicator provides visual cues for potential trading opportunities within the specified time frame, aiding traders in making informed decisions.
版本注释
Overview:The Golden Area indicator is designed to assist traders in identifying the most volatile trading areas and determining the prevailing market trend, whether bullish or bearish. This tool is especially useful for planning trades by providing clear signals based on market conditions.
Key Features:
*The indicator uses two moving averages, MA50 and MA200, to detect market trends. A crossover of the MA50 above the MA200 signals a bullish trend, while a crossunder indicates a bearish trend. These crossovers are visually represented on the chart, making it easy to identify trend changes at a glance.
How It Works:
The MA50 and MA200 are calculated based on the closing prices, providing a smooth representation of the market trend over medium and long periods.
For simplicity, recent lows and highs are used as support and resistance levels, helping traders understand potential price reversal points.
The indicator applies a time filter to focus on the most volatile trading periods. The background is shaded yellow during these times, highlighting the periods when the indicator's signals are most reliable.
Benefits for Traders:
By identifying volatile trading periods and market trends, traders can make more informed decisions about when to enter or exit trades.
The indicator provides clear visual cues for buy and sell signals, making it easy to spot trading opportunities.
Using the crossover of two significant moving averages, the indicator helps confirm market trends, reducing the risk of false signals.
Usage:
Add the Golden Area indicator to your chart and customize the MA50 and MA200 lengths as needed. Observe the highlighted trading periods and use the buy and sell signals to plan your trades effectively.
开源脚本
秉承TradingView的精神,该脚本的作者将其开源,以便交易者可以查看和验证其功能。向作者致敬!您可以免费使用该脚本,但请记住,重新发布代码须遵守我们的网站规则。
免责声明
这些信息和出版物并非旨在提供,也不构成TradingView提供或认可的任何形式的财务、投资、交易或其他类型的建议或推荐。请阅读使用条款了解更多信息。
开源脚本
秉承TradingView的精神,该脚本的作者将其开源,以便交易者可以查看和验证其功能。向作者致敬!您可以免费使用该脚本,但请记住,重新发布代码须遵守我们的网站规则。
免责声明
这些信息和出版物并非旨在提供,也不构成TradingView提供或认可的任何形式的财务、投资、交易或其他类型的建议或推荐。请阅读使用条款了解更多信息。