INVITE-ONLY SCRIPT
Gold Spotter
goldtrader.substack.com
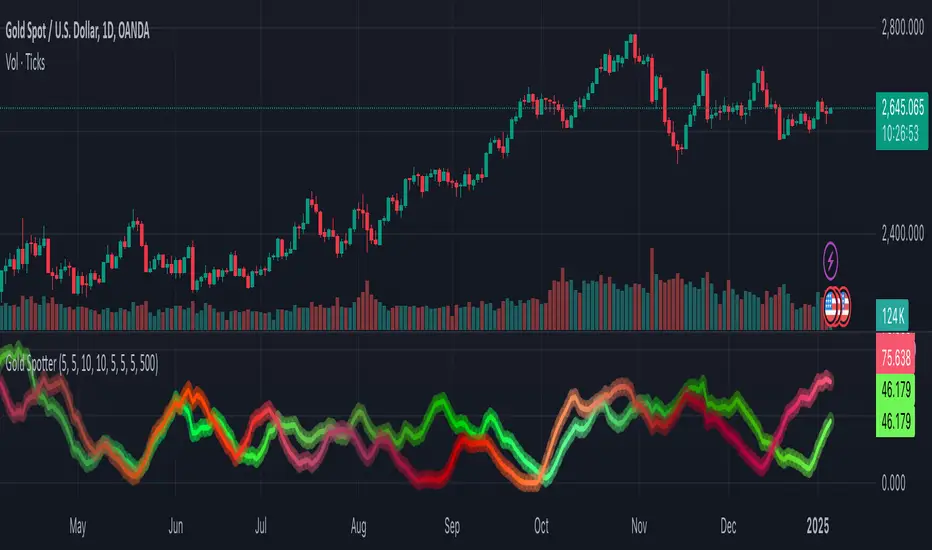
Two “Baskets” of Data
The script constructs two composite values (one green, one red) by fetching certain currency-related data in the background. Each composite is normalized over a lookback period so both lines map into a 0–100 range.
Weighting by Another Security’s Trend
A ratio is calculated from the chart’s own price vs. its moving average. That ratio is raised to a specified “power” (configured by the user), then used to scale each composite. This means if the price is above its average, both lines can be inflated; if below, both lines can be suppressed.
What the Lines Represent
Green Line: Represents a “pegged basket” index. (A small group of instruments that historically move in a certain way relative to Gold.)
Red Line: Represents an “exotics basket” index. (A different group of instruments that also has a meaningful relationship to Gold.)
What Is It Predicting
By measuring hidden relationships between these two baskets and weighting them by the chart’s trend, the green/red lines often provide an early read on which direction Gold might take next usually leading by 3-7 days.
仅限邀请脚本
只有作者授权的用户才能访问此脚本。您需要申请并获得使用许可。通常情况下,付款后即可获得许可。更多详情,请按照下方作者的说明操作,或直接联系JoeTheGoldTrader。
请注意,此私密、仅限邀请脚本未经脚本版主审核,是否符合网站规则尚未确定。 TradingView不建议您付费购买或使用任何脚本,除非您完全信任其作者并了解其工作原理。您也可以在我们的社区脚本找到免费的开源替代方案。
作者的说明
Please send me a message with your email address to be added.
免责声明
这些信息和出版物并非旨在提供,也不构成TradingView提供或认可的任何形式的财务、投资、交易或其他类型的建议或推荐。请阅读使用条款了解更多信息。