INVITE-ONLY SCRIPT
已更新 Alcides Indicator(AI) Lite
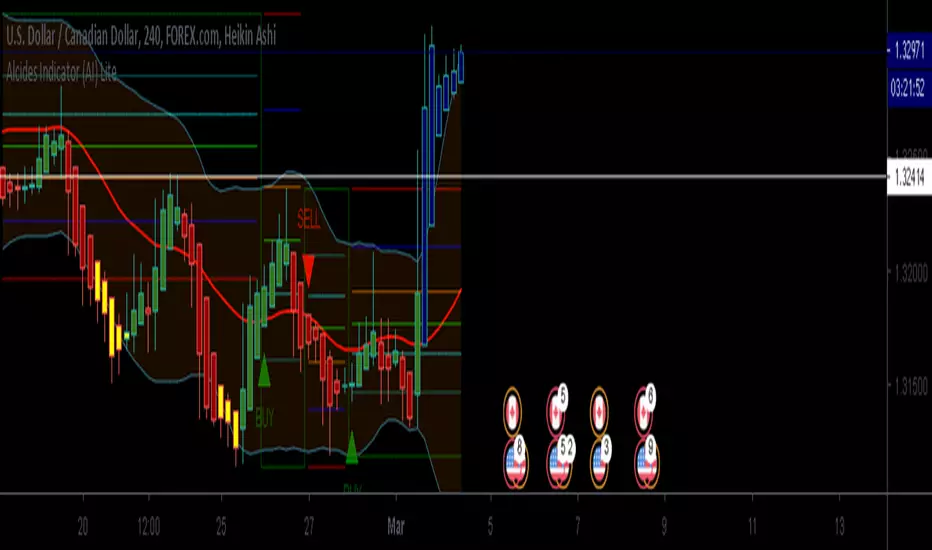
Alcides Indicator (AI) Lite is a simple to use indicator that can be used with any type of asset, trading in any market including FOREX, Stocks, Commodities, Cryptocurrencies etc. The Lite version uses levels from either 1 hr or 4 hr time frame based on user input to indicate entry (BUY) into or exit (SELL) from an asset. The indicator also plots support for BUYs and Resistance for SELLs which can be used as a reference while setting your Stop Loss. BUY, SELL and TAKE GAINS alerts can be set on trading view to help monitor the asset as well.
Even though the indicator signals BUYs and SELLs based on chosen Time Frame levels, the user must always use their discretion based on their TA and FA. Also, indicator repainting can occur based on time of signal/chart used (ex. 5m chart on 1 hr timeframe levels can repaint a BUY/SELL after 1 hr closes).
Works best with Heikin Ashi candles and lower timeframes like 5m, 15m, 30m.
The full version has more time frame levels to choose from, a few extra useful features and also recommends sell and buy levels based on the chosen time from.
Contact me for access and more information.
版本注释
Updated - Resolution instead of Timeframe for levels - 1m, 3m, 5m, 15m, 30m, 45m, 1hr, 2hr, 3hr, 1D, 1WAdded - Support/Resistance levels based on Fibonacci levels for chosen timeframe.
Added - Ability to specify % for Take Gains
版本注释
Added: Ability to show/hide FIB levels版本注释
Take Gains option removed as it wasn't adding any value.Default Alt timeframe - 3h
Note: Always use lower timeframe chart view than Indicator settings Timeframe
版本注释
Thanks for your support版本注释
Added - Ability to view Daily chart BUY/SELL with levels - Use 1W Alt Timeframe版本注释
Note added for new users at the top of Indicator settingsAlways use Higher Alt Time Frame than the Chart View Timeframe
Signal repainting possible - Use levels
版本注释
Updated - Simpler options for type of trade rather than alt TFAdded - Fib levels - 1.272, 1.414 and 1.618
版本注释
Added: Option to paint Oversold and Overbought RSI levels on candles - Choose the oversold and overbought levels to paint from the settings screen.
Updated:
Support/Resistance levels only show when BUY/SELL signals option is enabled.
版本注释
Thanks for your support.版本注释
Change colors/ fills from styles tab on the indicator settings to suit your background colour.版本注释
Added - Option to add Heikin Ashi Ichimoku to the chart from settings.Updated - Oversold levels up to 10 and Overbought levels up to 100 on RSI color candles
BUY/SELL + levels disabled on Daily/weekly charts
版本注释
Use BUY/SELL signals along with RSI candles, Ichimoku and Bollinger bands to make an informed decision and use levels.仅限邀请脚本
只有作者授权的用户才能访问此脚本。您需要申请并获得使用许可。通常情况下,付款后即可获得许可。更多详情,请按照下方作者的说明操作,或直接联系TradeChartist。
TradingView不建议您付费购买或使用任何脚本,除非您完全信任其作者并了解其工作原理。您也可以在我们的社区脚本找到免费的开源替代方案。
作者的说明
Get in touch with me if you would like access to my Premium scripts for a trial before deciding on lifetime access.
Telegram - @Trade_Chartist
Free Scripts - bit.ly/Free-Scripts
Telegram - @Trade_Chartist
Free Scripts - bit.ly/Free-Scripts
免责声明
这些信息和出版物并非旨在提供,也不构成TradingView提供或认可的任何形式的财务、投资、交易或其他类型的建议或推荐。请阅读使用条款了解更多信息。
仅限邀请脚本
只有作者授权的用户才能访问此脚本。您需要申请并获得使用许可。通常情况下,付款后即可获得许可。更多详情,请按照下方作者的说明操作,或直接联系TradeChartist。
TradingView不建议您付费购买或使用任何脚本,除非您完全信任其作者并了解其工作原理。您也可以在我们的社区脚本找到免费的开源替代方案。
作者的说明
Get in touch with me if you would like access to my Premium scripts for a trial before deciding on lifetime access.
Telegram - @Trade_Chartist
Free Scripts - bit.ly/Free-Scripts
Telegram - @Trade_Chartist
Free Scripts - bit.ly/Free-Scripts
免责声明
这些信息和出版物并非旨在提供,也不构成TradingView提供或认可的任何形式的财务、投资、交易或其他类型的建议或推荐。请阅读使用条款了解更多信息。