OPEN-SOURCE SCRIPT
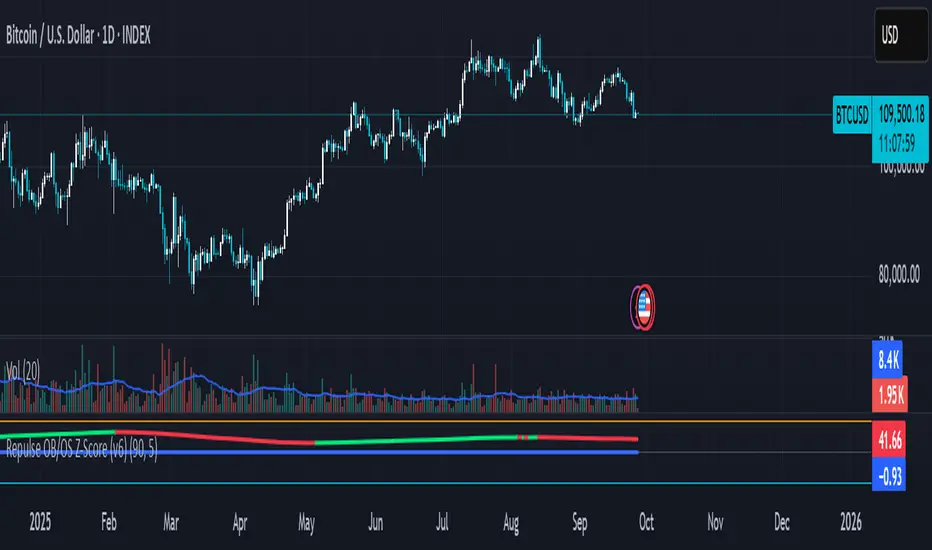
Repulse OB/OS Z-Score (v3)
🔹 What this script does
This indicator is an enhanced version of the Repulse, originally developed by Eric Lefort. The Repulse measures bullish and bearish pressure in the market by analyzing price momentum and crowd behavior.
In this version, I introduce a Z-Score transformation to the Repulse values. The Z-Score converts raw outputs into a standardized statistical scale, allowing traders to identify when pressure is abnormally high or low relative to historical conditions.
🔹 How it works
Repulse Core: The original Repulse calculation compares buying vs. selling pressure, highlighting shifts in momentum.
Z-Scoring Method: Repulse values are normalized around their mean and scaled by standard deviation. This transforms the indicator into a dimensionless metric, where:
Positive Z-Scores indicate stronger-than-usual bullish pressure.
Negative Z-Scores indicate stronger-than-usual bearish pressure.
Bands: Thresholds such as ±1 or ±2 Z-Scores can help detect when pressure is stretched, potentially signaling exhaustion or reversal points.
🔹 Why it’s useful
Statistical Clarity: Traders can instantly see whether current pressure is normal or extreme.
Cross-Asset Comparisons: Because Z-Scores are standardized, signals can be compared across different markets or timeframes.
Mean Reversion Tool: Extreme Z-Score values often precede turning points, making this a versatile addition to trend and momentum analysis.
🔹 How to use it
Apply the indicator to any chart and timeframe.
Watch for Z-Scores above +2 (possible overheated bullish pressure) or below –2 (possible oversold/exhaustion).
Use these levels as contextual signals, not standalone triggers. Best results come from combining with price structure, support/resistance, or volume analysis.
⚠️ Note: This script does not predict price. It highlights statistical extremes in pressure to support decision-making. Always use in combination with other tools and risk management practices.
开源脚本
秉承TradingView的精神,该脚本的作者将其开源,以便交易者可以查看和验证其功能。向作者致敬!您可以免费使用该脚本,但请记住,重新发布代码须遵守我们的网站规则。
免责声明
这些信息和出版物并非旨在提供,也不构成TradingView提供或认可的任何形式的财务、投资、交易或其他类型的建议或推荐。请阅读使用条款了解更多信息。
免责声明
这些信息和出版物并非旨在提供,也不构成TradingView提供或认可的任何形式的财务、投资、交易或其他类型的建议或推荐。请阅读使用条款了解更多信息。